Update on Multidimensional Poverty Measurement in Vietnam: Insights from 2016-2021 Data Analysis
Explore the latest findings on multidimensional poverty in Vietnam based on indicators from 2016 to 2021, including rates, indices, censored headcount ratios, and deprivation contributions, highlighting regional disparities and strategies for poverty reduction through targeted policies. Learn about upcoming indicators for 2022-2025, focusing on child nutrition, employment, and more. Discover the government's implementation of multi-dimensional poverty measurement in policies to support poor and near-poor households with education, health care, housing, and livelihood programs for sustainable poverty reduction.
Download Presentation

Please find below an Image/Link to download the presentation.
The content on the website is provided AS IS for your information and personal use only. It may not be sold, licensed, or shared on other websites without obtaining consent from the author. Download presentation by click this link. If you encounter any issues during the download, it is possible that the publisher has removed the file from their server.
E N D
Presentation Transcript
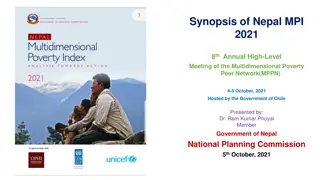
Update on Multidimensional Poverty Measurement in Vietnam 8th MPPN anual meeting 4-5/10/2021
Multi-dimensional Poverty Rate 2016- 2020 https://www.gso.gov.vn/wp- content/uploads/2021/03/Thong-cao-bao-chi- MDP_MPI_English.pdf
Multi-dimensional Poverty Index 2016- 2020 2016 2016 2019 2019 2020 2020 H H A A MPI MPI H H A A MPI MPI H H A A MPI MPI 35.3 Total 35.5 0.019 9.9 0.035 5.3 4.5 34.0 0.015 33.1 Urban 33.1 0.009 3.9 0.013 2.7 3.1 32.3 0.010 Area 35.6 Rural 36.0 0.024 12.7 0.045 6.7 5.3 34.6 0.018 31.5 Red River Delta 30.7 0.002 1.5 0.005 0.6 0.3 31.9 0.001 Northen Midland and Mountainous 37.2 37.6 0.040 17.4 0.065 10.7 7.8 36.4 0.028 North Central and Central Coastal 36.0 36.8 0.014 7.5 0.027 3.8 3.1 34.0 0.010 Region Central Highland 36.5 37.0 0.046 20.6 0.075 12.4 8.1 34.6 0.028 South East 32.3 33.5 0.013 4.9 0.016 3.8 5.4 32.4 0.018 Mekong River Delta 34.4 33.7 0.031 19.5 0.067 9.3 7.5 33.5 0.025 https://www.gso.gov.vn/wp- content/uploads/2021/03/Thong-cao-bao-chi- MDP_MPI_English.pdf
Censored Headcount Ratio of Each Indicator 2016-2020 (%) https://www.gso.gov.vn/wp- content/uploads/2021/03/Thong-cao-bao-chi- MDP_MPI_English.pdf
Contribution of Deprivation in Each Indicator to the Overall Multidimensional Poverty 2016-2020 (%) https://www.gso.gov.vn/wp- content/uploads/2021/03/Thong-cao-bao-chi- MDP_MPI_English.pdf
MDP indicator 2022-2025 1. Child Nutrions 1. Uncontracted employment Dependent ratio 2. +
Using Multi-Dimensional Poverty measurement in policy Decree of the Goverment ON MDP line: 07/ND-CP, 27/1/2021 Targeting: poor households, near poor households. Poor household is deprived at least 3 MDP indicators. Support policies on : Education (exemption of tution fee) Health care (free of health care insurance) Housing, Living condition (priority credit) National Target Program of Sustainable Poverty Reduction, components on: Vocational Training and Employment creation; Communication and Information
