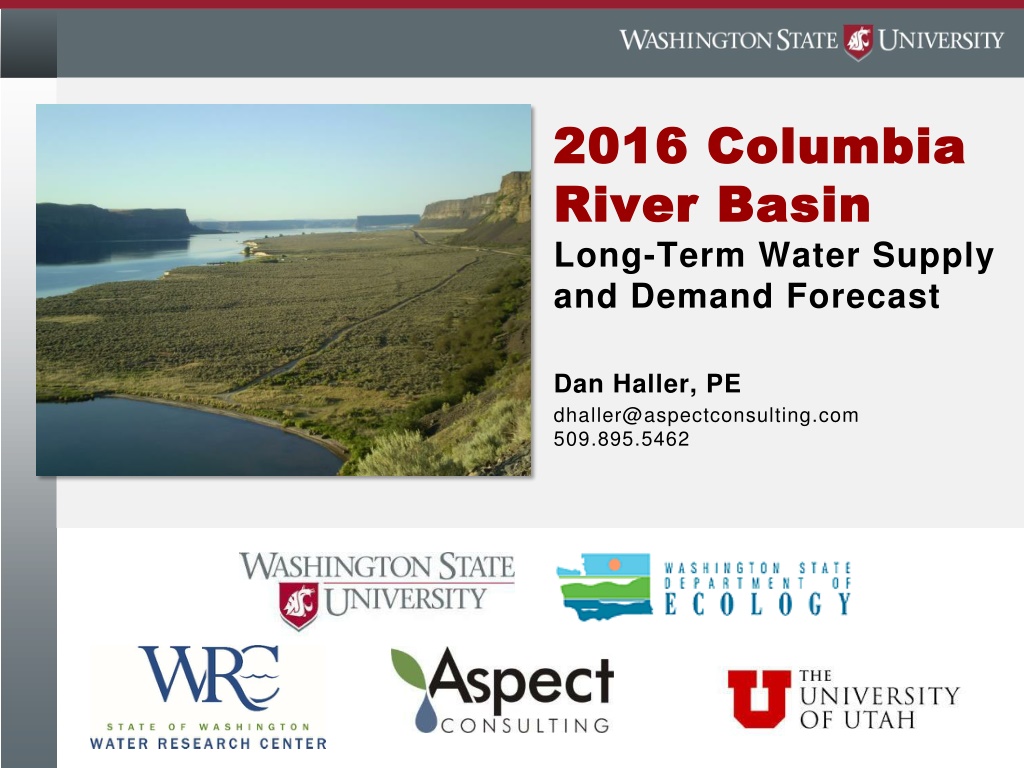
Long-Term Water Supply and Demand Forecast for Columbia River Basin
This comprehensive forecast covers water supply and demand projections in the Columbia River Basin through 2035, exploring various factors such as surface water supplies, climate change impacts, and emerging policy issues. The forecast aims to guide future investments and address the needs of agriculture, municipalities, hydropower, and instream flows. An analysis of the 2011 findings and upcoming improvements for the 2016 forecast are outlined, including groundwater evaluation and climate change predictions.

Download Presentation

Please find below an Image/Link to download the presentation.
The content on the website is provided AS IS for your information and personal use only. It may not be sold, licensed, or shared on other websites without obtaining consent from the author. Download presentation by click this link. If you encounter any issues during the download, it is possible that the publisher has removed the file from their server.
E N D
Presentation Transcript
2016 Columbia 2016 Columbia River Basin River Basin Long-Term Water Supply and Demand Forecast Dan Haller, PE dhaller@aspectconsulting.com 509.895.5462
2011 Water Supply & Demand Forecast Update required every 5 years Audience includes policy makers, water managers, general public Water and economic modeling Interviews with water managers Peer review Predicts agricultural, municipal, instream, and hydropower needs Guide for future investment Emerging policy issues
2011 Forecast Findings: Supply Water forecasted through 2030 Modeled surface water supply / demand Did not forecast GW supply / demand Supply: surface water supplies estimated to increase statewide by 3% average Climate change: water supply projected to shift earlier in the year WDFW created an Instream Atlas to help characterize fish flow, habitat, and utilization
2011 Forecast Findings: Demand Estimated Volume (acre-feet) Demand Type 170,000 2030 New Irrigation Demand 2030 New Municipal and Domestic Demand (including municipally-supplied commercial) 117,500 13,400,000 Unmet Columbia River Instream Flows 500,000 Unmet Tributary Instream Flows 0 2030 New Hydropower Demand 164,000 Alternate Supply for Odessa Yakima Basin Water Supply (pro-ratables, municipal/domestic and fish) 450,000 40,000 to 310,000 Unmet Columbia River Interruptibles
2016 Forecast Analysis Will Forecast through 2035 Include groundwater evaluation Improve hydrology, cropping models, consumptive loss simulation Include climate change predictions Forecast water right and reservoir curtailment Evaluate potential for the forecast to be extended to Western WA in 2021 Evaluate policy issues necessary for program administration and investments
Policy Issues in 2016 Forecast Water Banking: How can water banking assist in meeting demand? Cost Effects of Water: How is an applicant-pays model affecting program participation? METRIC: How can remote sensing improve demand projections? Groundwater Integration: Where and how much will declining groundwater supplies affect demand?
Water Banking In Washington Insert figure 5 here WA Water Banks Private 11 Quasi-Gov t & NGO 4 Public 13
Cost Effects of Water Legislature has moved towards an applicant-pays system o Cost-reimbursement permitting o Recovery of water supply development costs Some applicants are choosing to defer or postpone rather than receive new water rights when offered This study will survey 500 applicants from various programs (Lake Roosevelt, Wenatchee, Yakima, Cabin Owners, etc.) to understand how time and financial terms of a program are affecting processing and demand for new service
Cost Effects of Water: Policy Considerations What price points incentivize applicant participation? What other program criteria affect participation (e.g. lead time, water right type, purpose of use, location)? What should Ecology s reaction be to applicants that decline processing? Should application requirements be augmented to better reflect processing level of effort?
METRIC: Forecasting Irrigation Use METRIC uses field-calibrated satellite imagery to improve consumptive use forecasting Predict agricultural crop consumption and return flows at the field and watershed scales Pilot 3 subbasins: Walla Walla Basin, Yakima Basin and Okanogan Basin Model inputs from volunteer farms: o Soil moisture o Weather data (wind speed, temperature, heat flux) o Applied irrigation (Applied Water Duty) o Landsat flights
Groundwater Integration New component for 2016 Forecast Why: o 2011 Forecast did not evaluate effects of declining groundwater on demand o Users who rely on declining groundwater supplies may rely on surface water in the future o Surface and groundwater interactions can lead to water rights conflicts Goals: o Improve forecasting of groundwater shortages by identifying data gaps and use existing tools to predict the scope of the problem o Estimate surface water demand changes caused by groundwater shortages
Forecast Report 50+ page Summary Report WRIA-focused pages Large Technical Report Web applications / content Instream Flow Atlas Update
Schedule / Opportunities for Input Data collection and modeling in 2015 Presentations to stakeholder groups in 2015 Watershed planning input in 2015 Sector expert input in 2015 Analysis and draft results in early 2016 Public workshops and draft report in summer 2016 Final Report Due November 15, 2016