Understanding UV-Vis Spectroscopy and Electronic Transitions
UV-Vis spectroscopy involves studying the absorption of electromagnetic radiation by molecules, leading to electronic transitions. This process results in the excitation of electrons and can be observed through color changes. Different molecular structures exhibit unique absorption patterns, influenced by factors like conjugation and energy gaps. By analyzing the UV-Vis spectrum of compounds like Tetraphenylcyclopentadienone, we can gain insights into their electronic properties and structural features.

Download Presentation

Please find below an Image/Link to download the presentation.
The content on the website is provided AS IS for your information and personal use only. It may not be sold, licensed, or shared on other websites without obtaining consent from the author. Download presentation by click this link. If you encounter any issues during the download, it is possible that the publisher has removed the file from their server.
E N D
Presentation Transcript
Lecture 6c UV-Vis Spectroscopy
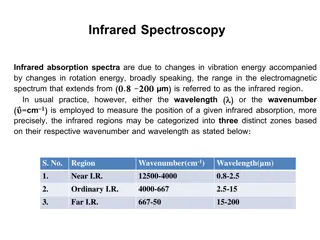
Introduction Electromagnetic Spectrum High energy Low energy Visible range: =380-750 nm Ultraviolet: =190-380 nm
Electronic Transitions Most molecules absorb electromagnetic radiation in the visible and/or the ultraviolet range. The absorption of electromagnetic radiation causes electrons to be excited, which results in a promotion of an electron from a bonding ( or ) or non-bonding orbital (n)to an anti-bonding orbital ( * or *). The larger the energy gap is, the higher the frequency and the shorter the wavelength of the radiation required is (h= Planck s constant). Allowed transitions i.e., - *, - * are usually strong (large ), while forbidden transitions (low ) i.e., n- *, n- * are much weaker compared to these. Many transition metal compounds are colored because the d-d transitions fall in the visible range (note that the d-orbitals are not shown to keep the diagram simple). hc = h = E h= 6.626*10-34 J*s c= 3.00*108 m/s
Color Wheel When determining a color, one has to know if the process that causes the color is due to emission or due to absorption of electromagnetic radiation. Example 1: Sodium atoms emit light at =589 nm resulting in a yellow-orange flame. Example 2: Indigo absorbs light at =605 nm, which is in the orange range the compound assumes the complementary color (blue-purple).
What determines the Wavelength? max(nm) 178 180 480 224 246 (cm-1*mol-1*L) Chromophore 26000 900 133000 12590 9800 Compound 1,4-Pentadiene 2-Pentanone -Carotene 3-Pentenone Acetophenone isolated C=C isolated C=O conjugated C=C conjugated C=O conjugated C=O Most simple alkenes and ketones absorb in the UV-range because the * and the n- * energy gaps are quite large. Conjugation causes a bathochromic shift (red shift). Increased conjugation often also increases the peak size as well (hyperchromic). http://upload.wikimedia.org/wikipedia/commons/thumb/3/37/Beta-carotene-2D-skeletal.svg/450px-Beta-carotene-2D-skeletal.svg.png
Conjugation The - * energy gap for the C=C bond is large. The - * and the n- * energy gap in a C=O bond are both relatively large as well. The combination of these two groups affords a new orbital set in which n- * and the - * gaps are much smaller compared in the isolated bonds. If less energy is required to excite the electrons, a shift to higher wavelengths for the excitation will be observed i.e., (n- *) > ( - *). n n C=C C=C-C=O C=O
UV-Vis Spectrum of TPCP Tetraphenylcyclopentadienone (nm) 500 - * 330 nm Solvent Methanol 1120 331 6460 258 24500 Dioxane 504 1410 332 7080 260 26000 n- * 500 nm Cyclohexane 512 1320 335 7100 262 27100 600 nm 300 nm Bottom line: The exact peak location ( ) and absolute peak intensity ( ) depend to a certain degree on the solvent used in the measurement.
Beer Lambert Law I It describes the attenuation of electromagnetic radiation. A = * * c l The cell dimension (l) is usually 1 cm. The -value is wavelength dependent a spectrum is a plot of the -values as the function of the wavelength. The larger the -value is, the larger the peak is going to be. The data given in the literature only list the wavelengths and -values (or its log value) of the peak maxima i.e., 331 (6460). The desirable concentration of the sample is determined by the largest and smallest -values of the peaks in the spectral window to be measured.
Beer Lambert Law II The absorbance readings for the sample have to be in the range from Amin=0.1 and Amax=1 in order to be reliable. The concentration limitations are due to Association at higher concentrations (c>10-4 M). Linear response of the detector in the UV-spectrophotometer. 1.0 Absorbance Linear range 0.1 cmin cmax Concentration
Practical Aspects of UV-Vis I Cuvette It cannot absorb in the measurement window: Plastic cuvettes absorb more or less in the UV-range already. Most test tubes (borosilicates) start to absorb around 340 nm. Quartz cuvettes have a larger optical window but are very expensive (>$100 each). It has to be stable towards the solvent and the compound: Most plastic cuvettes are etched or dissolved by low polarity solvents and can only be used with alcohols or water. Quartz cuvettes are stable when used with most organic solvents. 1. Polystyrene 2. Polymethacrylate 3. Quartz lamp detector Polyethylene cuvette
Practical Aspects of UV-Vis II Solvent lower limit ( in nm) Absorbance for l=1 cm 330 335 (0.30), 340 (0.08), 350 (0.003) 190 200 (0.10), 210 (0.046), 230 (0.009) 265 250 (0.40), 260 (0.05), 270 (0.006) 210 210 (0.70), 220 (0.32), 230 (0.11), 240 (0.04) 235 230 (1.30), 240 (0.15), 250 (0.02) 210 210 (0.70), 220 (0.4), 240 (0.1), 260 (0.009) 210 210 (0.30), 220 (0.1), 230 (0.03), 240 (0.016) 210 220 (0.22), 230 (0.1), 240 (0.046), 250 (0.02) 191 Solvent Acetone Acetonitrile Chloroform Cyclohexane Dichloromethane Ethanol (abs.) Hexane Methanol Water Hydrocarbons and alcohols possess the largest optical windows. Note that spectrograde solvents should be used whenever possible because many non-spectrograde solvents contain additives i.e., 95 % ethanol contains a lot of aromatics that are active in the UV range.
Practical Aspects of UV-Vis III Important Pointers Since most measurements require a serial dilution, it is imperative that the entire compound is dissolved when preparing the stock solution. For the calculation of the new concentration, the student needs to keep in mind that the total volume is important i.e., if 1 mL of the stock solution was used and 9 mL of additional solvent, the concentration is one tenth of the original concentration. The student has to run a full spectrum, which requires the software to be set to spectrum mode and not to fixed wavelength mode (see pop down window in the upper left hand corner).
Practical Aspects of UV-Vis IV UV-Vis detector is used in HPLC The chromatogram changes significantly as the wavelength is changed because compounds display different -values at a given wavelength. The different absorbance characteristics can be used to detector specific compounds and other not. The linear range for quantitation is limited and given by the wavelength chosen for quantitation.