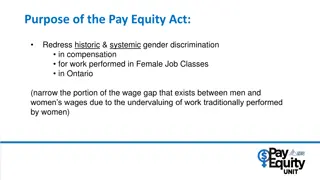
Pay-for-Performance: The Next Generation of Program Designs

Pay-for-Performance (P4P) programs have shown mainly positive results but with small effects. However, there have been design mistakes such as setting up tournaments and focusing on unimportant aspects of care measurement. The study discussed in New York City involving small practices with a high Medicaid patient percentage tested P4P incentives clustered at the clinic level based on physician feedback.

Download Presentation

Please find below an Image/Link to download the presentation.
The content on the website is provided AS IS for your information and personal use only. It may not be sold, licensed, or shared on other websites without obtaining consent from the author. Download presentation by click this link. If you encounter any issues during the download, it is possible that the publisher has removed the file from their server.
E N D
Presentation Transcript
Pay-for-Performance: The Next Generation of Program Designs R. Adams Dudley, MD, MBA Director, UCSF Center for Healthcare Value Assoc. Dir. for Research, Philip R. Lee Institute for Health Policy Studies University of California, San Francisco adams.dudley@ucsf.edu Follow on Twitter: @RAdamsDudleyMD Support: AHRQ, California Health Care Foundation, California Department of Insurance, Robert Wood Johnson Foundation, Robin Hood Foundation No financial relationships to disclose.
Outline Pay-for-performance: Not knocking our socks off But it works Next generation ideas Linking PFP to other novel payment approaches
Summary of the P4P Literature (So Far) Mainly positive results, but small effects Some mistakes we ve made in design: Setting up tournaments (e.g., top 10% get a bonus) Disadvantages: lower performers at baseline don t try, middle performers have uncertainty about whether there is a good ROI Pay on percent performance Disadvantages: encourages avoidance of difficult patients Choose unimportant aspects of care to measure Reasons for unimportance: topped out, minor clinical process
Pay-for-Performance in High- Medicaid Practices: Implications from a Cluster-Randomized Trial in New York City Bardach, NS, Wang, JJ, De Leon, SF, Shih, SC, Boscarin, WJ, Goldman, LE, Dudley, RA. Effect of Pay-for-Performance Incentives on Quality of Care in Small Practices with Electronic Health Records: A Randomized Trial. JAMA, 2013 Sep 11;310(10):1051-9 http://www.robinhood.org/media/app/logo.gif
Study Design A cluster-randomized, controlled trial of incentives Clustered at the clinic level for randomization Incentives also paid at the clinic level P4P incentive design BASED ON PHYSICIAN FEEDBACK
Population 84 small (1-2 providers) practices in New York City with a high % of Medicaid patients All practices were participants in Primary Care Improvement Project (PCIP) Electronic Health Record (EHR) with clinical decision support reminders for measures Ongoing quality improvement site visits available (not required)
Incentive Structure: Pay More for What Is Harder Total Possible Payment per Patient Base Payment Payment for High-Risk Patients Insurance: Commercial Co-morbidity: No IVD or DM Qualifying Insurance: Uninsured Medicaid Combination of qualifying insurance and co-morbidity: Uninsured/Medi caid and IVD/DM Qualifying Co- Morbidities: IVD or DM Aspirin BP Control Smoking Cessation - - $20 $40 $20 $20 $80 $20 $20 $80 $20 $20 $20 $40 $20 Maximums: $200 per patient. $100,000 per practice IVD: Ischemic Vascular Disease; DM: Diabetes Mellitus
Research questions What is the effect of a pay-for-performance program in small, Medicaid-focused practices on cardiovascular outcomes and processes when the program has the following features?: Pay for each patient where the outcome is achieved (not a percent of patients, not a tournament) Pay more for what is harder achieving the outcome in patients who are harder for clinical or socioeconomic reasons How will providers feel about the program?
Quality measures Antithrombotic prescribed Patients with Diabetes or IVD* Antithrombotic Rx A Blood pressure control( BP ) BP controlled (<140/90 or <130/80) Patients with hypertension B Smoking Cessation Intervention Intervention delivered Patients who smoke S *IVD: Ischemic Vascular Disease; TC: Total Cholesterol; LDL: Low Density Lipoprotein
Analysis Difference-in-differences approach to quantify the effect size in each cohort Compares the difference in performance change over time between intervention and control clinics
Baseline Characteristics of Intervention and Control Clinics Clinic Characteristics Incentive Control P value Clinicians, median (IQR) 1 (1-2) 1 (1-2) 0.77 Patients, median (IQR) 2500 (1200-4607) 9.93 (4.47) 2000 (1100-3500) 9.57 (4.44) 0.45 Time since EHR implementation, mo QI specialist visits 0.81 5.17 (3.43) 4.24 (2.73) 0.25 Insurance, % Commercial 33.8 (23.9) 32.1 (21.6) 0.89 Medicare 25.6 (22.0) 26.8 (17.6) 0.32 Medicaid 35.3 (28.3) 35.7 (24.8) 0.88 Uninsured 4.3 (4.8) 4.7 (4.9) 0.60
Results: Baseline Performance Measure Aspirin therapy, CAD or DM BP control, no comorbidities Blood pressure control, CAD BP control, DM Cholesterol control, non-comorbid Smoking cessation intervention Control (%) 54.4 31.8 46.0 10.4 89.7 19.1 Incentive (%) 52.6 52.1 68.4 16.8 88.2 17.1 P value <0.05 <0.05 Year 1
Results: Baseline Performance Measure Aspirin therapy, CAD or DM BP control, no comorbidities Blood pressure control, CAD BP control, DM Cholesterol control, non-comorbid Smoking cessation intervention Control (%) 54.4 31.8 46.0 10.4 89.7 19.1 Incentive (%) 52.6 52.1 68.4 16.8 88.2 17.1 P value <0.05 <0.05 Year 1
Performance of Incentive Arm Compared to Control Arm Measure Absolute difference in performance improvement between groups over study period (%) 6.0 5.5 -9.1 7.8 -1.2 P-value 0.001 0.01 0.23 0.007 0.22 Aspirin therapy, CAD or DM BP control, no comorbidities Blood pressure control, CAD BP control, DM Cholesterol control, non- comorbid Smoking cessation intervention 4.7 0.02 Year 1
Providers Attitudes about the Quality Measures and the P4P Program Begum, R, Smith Ryan, M, Winther, CH, Wang, JJ, Bardach, NS, Parsons, AH, Shih, SC, Dudley, RA. Small Practices Experience with EHR, Quality Measurement, and Incentives. American Journal of Managed Care, 2013 Nov;19(10 Spec No):eSP12-8 http://www.robinhood.org/media/app/logo.gif
Clinician Experiences and Attitudes towards QI N=104 (74% response rate) Had a visit with QI staff (p=0.01) Incentive 67.9% Control 42.9% Future intention to generate QI reports (p=0.09) Incentive 86.5% Control 71.7% Future intention to track clinic progress on ABCS (p=0.07) Incentive 90.6% Control 78.3% 16
Future of P4P Pay more for what s harder Pay for each patient (not %s or tournaments) Avoid topped out measures P4P probably more acceptable when introduced in a context where support for improvement is also available Advice to clinics: invest in using QI tools decision support, registries 19


")