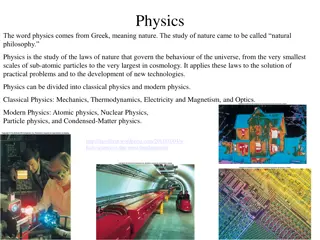
Understanding Quantitative Comparison of Data and Models in Modern Physics
Explore the concepts of errors in measurements and models, linear regression, quantifying precision and random errors, single and multiple measurements of the same quantity, and the importance of accuracy and precision in scientific experiments. Dive into the fundamental principles of physics and error analysis for better understanding and interpretation of experimental data.

Download Presentation

Please find below an Image/Link to download the presentation.
The content on the website is provided AS IS for your information and personal use only. It may not be sold, licensed, or shared on other websites without obtaining consent from the author. Download presentation by click this link. If you encounter any issues during the download, it is possible that the publisher has removed the file from their server.
E N D
Presentation Transcript
Intermediate Lab PHYS 3870 Lecture 4 Comparing Data and Models Quantitatively Introduction Section 0 Lecture 1 Slide 1 Linear Regression References: Taylor Ch. 8 and 9 INTRODUCTION TO Modern Physics PHYX 2710 Also refer to Glossary of Important Terms in Error Analysis Fall 2004 Intermediate 3870 Lecture 5 Slide 1 LINEAR REGRESSION Fall 2013
Intermediate Lab PHYS 3870 Errors in Measurements and Models Introduction Section 0 Lecture 1 Slide 2 A Review of What We Know INTRODUCTION TO Modern Physics PHYX 2710 Fall 2004 Intermediate 3870 Lecture 5 Slide 2 LINEAR REGRESSION Fall 2013
Quantifying Precision and Random (Statistical) Errors The best value for a group of measurements of the same quantity is the Average What is an estimate of the random error? Deviations A.If the average is the the best guess, then DEVIATIONS (or discrepancies) from best guess are an estimate of error B.One estimate of error is the range of deviations. Introduction Section 0 Lecture 1 Slide 3 INTRODUCTION TO Modern Physics PHYX 2710 Fall 2004 Intermediate 3870 Lecture 5 Slide 3 LINEAR REGRESSION Fall 2013
Single Measurement: Comparison with Other Data Comparison of precision or accuracy? Introduction Section 0 Lecture 1 Slide 4 ?1 ?2 1 2 ?1+ ?2 ????????????????? = INTRODUCTION TO Modern Physics PHYX 2710 Fall 2004 Intermediate 3870 Lecture 5 Slide 4 LINEAR REGRESSION Fall 2013
Single Measurement: Direct Comparison with Standard Introduction Section 0 Lecture 1 Slide 5 Comparison of precision or accuracy? ???????????? = ?????????? ?????? ?????? INTRODUCTION TO Modern Physics PHYX 2710 Fall 2004 Intermediate 3870 Lecture 5 Slide 5 LINEAR REGRESSION Fall 2013
Multiple Measurements of the Same Quantity Our statement of the best value and uncertainty is: ( <t> t) sec at the 68% confidence level for N measurements 1. Note the precision of our measurement is reflected in the estimated error which states what values we would expect to get if we repeated the measurement 2. Precision is defined as a measure of the reproducibility of a measurement 3. Such errors are called random (statistical) errors 4. Accuracy is defined as a measure of who closely a Introduction Section 0 Lecture 1 Slide 6 measurement matches the true value 5. Such errors are called systematic errors INTRODUCTION TO Modern Physics PHYX 2710 Fall 2004 Intermediate 3870 Lecture 5 Slide 6 LINEAR REGRESSION Fall 2013
Multiple Measurements of the Same Quantity Standard Deviation The best guess for the error in a group of N identical randomly distributed measurements is given by the standard deviation this is the rms (root mean squared deviation or (sample) standard deviation It can be shown that (see Taylor Sec. 5.4) t is a reasonable estimate of the uncertainty. In fact, for normal (Gaussian or purely random) data, it can be shown that (1)68% of measurements of t will fall within <t> t (2)95% of measurements of t will fall within <t> 2 t (3)98% of measurements of t will fall within <t> 3 t Introduction Section 0 Lecture 1 Slide 7 (4)this is referred to as the confidence limit Summary: the standard format to report the best guess and the limits within which you expect 68% of subsequent (single) measurements of t to fall within is <t> t INTRODUCTION TO Modern Physics PHYX 2710 Fall 2004 Intermediate 3870 Lecture 5 Slide 7 LINEAR REGRESSION Fall 2013
Multiple Sets of Measurements of the Same Quantity Standard Deviation of the Mean If we were to measure t again N times (not just once), we would be even more likely to find that the second average of N points would be close to <t>. The standard error or standard deviation of the mean is given by This is the limits within which you expect the average of N addition Introduction Section 0 Lecture 1 Slide 8 measurements to fall within at the 68% confidence limit INTRODUCTION TO Modern Physics PHYX 2710 Fall 2004 Intermediate 3870 Lecture 5 Slide 8 LINEAR REGRESSION Fall 2013
Errors PropagationError in Models or Derived Quantities Define error propagation [Taylor, p. 45] A method for determining the error inherent in a derived quantity from the errors in the measured quantities used to determine the derived quantity Recall previous discussions [Taylor, p. 28-29] I. Absolute error: ( <t> t) sec II.Relative (fractional) Error: <t> sec ( t/<t>)% III.Percentage uncertainty: fractional error in % units Introduction Section 0 Lecture 1 Slide 9 INTRODUCTION TO Modern Physics PHYX 2710 Fall 2004 Intermediate 3870 Lecture 5 Slide 9 LINEAR REGRESSION Fall 2013
Specific Rules for Error Propagation (Worst Case) Refer to [Taylor, sec. 3.2] for specific rules of error propagation: 1.Addition and Subtraction [Taylor, p. 49] For qbest=xbest ybest the error is q x+ y Follows from qbest q =(xbest x) (ybest y)= (xbest ybest) ( x y) 2.Multiplication and Division [Taylor, p. 51] For qbest=xbest * ybest the error is ( q/ qbest) ( x/xbest)+( y/ybest) 3.Multiplication by a constant (exact number) [Taylor, p. 54] For qbest= B(xbest ) the error is ( q/ qbest) |B| ( x/xbest) Follows from 2 by setting B/B=0 Introduction Section 0 Lecture 1 Slide 10 4.Exponentiation (powers) [Taylor, p.56] For qbest= (xbest )n the error is ( q/ qbest) n ( x/xbest) Follows from 2 by setting ( x/xbest)=( y/ybest) INTRODUCTION TO Modern Physics PHYX 2710 Fall 2004 Intermediate 3870 Lecture 5 Slide 10 LINEAR REGRESSION Fall 2013
General Formula for Error Propagation General formula for uncertainty of a function of one variable x x Can you now derive for specific rules of error propagation: 1.Addition and Subtraction [Taylor, p. 49] 2.Multiplication and Division [Taylor, p. 51] 3.Multiplication by a constant (exact number) [Taylor, p. 54] 4.Exponentiation (powers) [Taylor, p. 56] [Taylor, Eq. 3.23] q = q Introduction Section 0 Lecture 1 Slide 11 INTRODUCTION TO Modern Physics PHYX 2710 Fall 2004 Intermediate 3870 Lecture 5 Slide 11 LINEAR REGRESSION Fall 2013
General Formula for Multiple Variables Uncertainty of a function of multiple variables [Taylor, Sec. 3.11] 1. It can easily (no, really) be shown that (see Taylor Sec. 3.11) for a function of several variables + y x 2.More correctly, it can be shown that (see Taylor Sec. 3.11) for a function of several variables + y x where the equals sign represents an upper bound, as discussed above. 3.For a function of several independent and random variables Worst case q q q = + + ( , , ,...) ... q x y z x y z [Taylor, Eq. 3.47] z q q q + + ( , , ,...) ... q x y z x y z [Taylor, Eq. 3.47] z Introduction Section 0 Lecture 1 Slide 12 = z y x q Best case 2 2 2 q q q + + + ( , , ,...) ... x y z [Taylor, Eq. 3.48] x y z INTRODUCTION TO Modern Physics PHYX 2710 Again, the proof is left for Ch. 5. Fall 2004 Intermediate 3870 Lecture 5 Slide 12 LINEAR REGRESSION Fall 2013
Error Propagation: General Case Thus, if x and y are: a)Independent (determining x does not affect measured y) b)Random (equally likely for + x as x ) Then method the methods above overestimate the error Consider the arbitrary derived quantity q(x,y) of two independent random variables x and y. Expand q(x,y) in a Taylor series about the expected values of x and y (i.e., at points near X and Y). Fixed, shifts peak of distribution ? ?,? = ? ?,? + ?? ? ? + ?? (? ?) ?? ?? ? ? Fixed Distribution centered at X with width X Introduction Section 0 Lecture 1 Slide 13 Error for a function of Two Variables: Addition in Quadrature 2 2 INTRODUCTION TO Modern Physics PHYX 2710 ?? ?,? = ??= ?? + ?? Best case ?? ??? ?? ?? Fall 2004 ? Intermediate 3870 Lecture 5 Slide 13 LINEAR REGRESSION Fall 2013
Independent (Random) Uncertaities and Gaussian Distributions For Gaussian distribution of measured values which describe quantities with random uncertainties, it can be shown that (the dreaded ICBST), errors add in quadrature [see Taylor, Ch. 5] q x + y But, q = [( x)2 + ( y)2] 1.This is proved in [Taylor, Ch. 5] 2.ICBST [Taylor, Ch. 9] Method A provides an upper bound on the possible errors Introduction Section 0 Lecture 1 Slide 14 INTRODUCTION TO Modern Physics PHYX 2710 Fall 2004 Intermediate 3870 Lecture 5 Slide 14 LINEAR REGRESSION Fall 2013
Gaussian Distribution Function Independent Variable Center of Distribution (mean) Distribution Function Normalization Constant Width of Distribution (standard deviation) Gaussian Distribution Function Introduction Section 0 Lecture 1 Slide 15 INTRODUCTION TO Modern Physics PHYX 2710 Fall 2004 Intermediate 3870 Lecture 5 Slide 15 LINEAR REGRESSION Fall 2013
Standard Deviation of Gaussian Distribution See Sec. 10.6: Testing of Hypotheses 5 ppm or ~5 Valid for HEP 1% or ~3 Highly Significant 5% or ~2 Significant 1 Within errors Area under curve (probability that <x<+ ) is 68% Introduction Section 0 Lecture 1 Slide 16 INTRODUCTION TO Modern Physics PHYX 2710 Fall 2004 More complete Table in App. A and B Intermediate 3870 Lecture 5 Slide 16 LINEAR REGRESSION Fall 2013
Mean of Gaussian Distribution as Best Estimate Principle of Maximum Likelihood To find the most likely value of the mean (the best estimate of ), find X that yields the highest probability for the data set. Consider a data set {x1, x2, x3 xN } Each randomly distributed with 1 1 ? 2?? (?? ?)22? ?? (?? ?)22? ?????,? ??= ??,? ?? The combined probability for the full data set is the product 1 1 1 1 ?? (?1 ?)22? ?? (?2 ?)22? ?? (?? ?)22? ??? (?? ?)22? = Introduction Section 0 Lecture 1 Slide 17 Best Estimate of X is from maximum probability or minimum summation Solve for derivative set to 0 Minimize Sum Best estimate of X INTRODUCTION TO Modern Physics PHYX 2710 Fall 2004 Intermediate 3870 Lecture 5 Slide 17 LINEAR REGRESSION Fall 2013
Uncertaity of Best Estimates of Gaussian Distribution Principle of Maximum Likelihood To find the most likely value of the mean (the best estimate of ), find X that yields the highest probability for the data set. Consider a data set {x1, x2, x3 xN } The combined probability for the full data set is the product 1 1 1 1 ?? (?1 ?)22? ?? (?2 ?)22? ?? (?? ?)22? ??? (?? ?)22? = Best Estimate of X is from maximum probability or minimum summation Solve for derivative wrst X set to 0 Minimize Sum Best estimate of X Introduction Section 0 Lecture 1 Slide 18 Best Estimate of is from maximum probability or minimum summation Solve for derivative wrst set to 0 Best estimate of See Prob. 5.26 INTRODUCTION TO Modern Physics PHYX 2710 Minimize Sum Fall 2004 Intermediate 3870 Lecture 5 Slide 18 LINEAR REGRESSION Fall 2013
Weighted Averages Question: How can we properly combine two or more separate independent measurements of the same randomly distributed quantity to determine a best combined value with uncertainty? Introduction Section 0 Lecture 1 Slide 19 INTRODUCTION TO Modern Physics PHYX 2710 Fall 2004 Intermediate 3870 Lecture 5 Slide 19 LINEAR REGRESSION Fall 2013
Weighted Averages The probability of measuring two such measurements is ????? ?1,?2= ????? ?1????? ?2 1 ?1?2? ?2/2? ????2 ?1 ? To find the best value for X, find the maximum Prob or minimum X2 Best Estimate of is from maximum probibility or minimum summation 2+ ?2 ? 2 = ?1 ?2 Solve for derivative wrst set to 0 Minimize Sum Solve for best estimate of This leads to = ???? ?? ??_???= ?1?1+ ?2?2 ? ?????= 1 ??2 ?1+ ?2 Introduction Section 0 Lecture 1 Slide 20 Note: If w1=w2, we recover the standard result Xwavg= (1/2) (x1+x2) 1 Finally, the width of a weighted average distribution is ????? ??????= INTRODUCTION TO Modern Physics PHYX 2710 ?? ? Fall 2004 Intermediate 3870 Lecture 5 Slide 20 LINEAR REGRESSION Fall 2013
Intermediate Lab PHYS 3870 Comparing Measurements to Models Linear Regression Introduction Section 0 Lecture 1 Slide 21 INTRODUCTION TO Modern Physics PHYX 2710 Fall 2004 Intermediate 3870 Lecture 5 Slide 21 LINEAR REGRESSION Fall 2013
Motivating Regression Analysis Question: Consider now what happens to the output of a nearly ideal experiment, if we vary how hard we poke the system (vary the input). Uncertainties in Observations Input Output SYSTEM The Universe Introduction Section 0 Lecture 1 Slide 22 The simplest model of response (short of the trivial constant response) is a linear response model y(x) = A + B x INTRODUCTION TO Modern Physics PHYX 2710 Fall 2004 Intermediate 3870 Lecture 5 Slide 22 LINEAR REGRESSION Fall 2013
Questions for Regression Analysis The simplest model of response (short of the trivial constant response) is a linear response model y(x) = A + B x Three principle questions: What are the best values of A and B, for: (see Taylor Ch. 8) A perfect data set, where A and B are exact? A data set with uncertainties? Introduction Section 0 Lecture 1 Slide 23 What are the errors in the fitting parameters A and B? INTRODUCTION TO Modern Physics PHYX 2710 What confidence can we place in how well a linear model fits the data? (see Taylor Ch. 9) Fall 2004 Intermediate 3870 Lecture 5 Slide 23 LINEAR REGRESSION Fall 2013
Intermediate Lab PHYS 3870 Review of Graphical Analysis Introduction Section 0 Lecture 1 Slide 24 INTRODUCTION TO Modern Physics PHYX 2710 Fall 2004 Intermediate 3870 Lecture 5 Slide 24 LINEAR REGRESSION Fall 2013
Graphical Analysis An old School approach to linear fits. Rough plot of data Estimate of uncertainties with error bars A best linear fit with a straight edge Estimates of uncertainties in slope and intercept from the error bars This is a great practice to get into as you are developing an experiment! Introduction Section 0 Lecture 1 Slide 25 INTRODUCTION TO Modern Physics PHYX 2710 Fall 2004 Intermediate 3870 Lecture 5 Slide 25 LINEAR REGRESSION Fall 2013
Is it Linear? A simple model is a linear model You know it when you see it (qualitatively) Tested with a straight edge Error bar are a first step in gauging the goodness of fit Introduction Section 0 Lecture 1 Slide 26 Adding 2D error bars is sometimes helpful. INTRODUCTION TO Modern Physics PHYX 2710 Fall 2004 Intermediate 3870 Lecture 5 Slide 26 LINEAR REGRESSION Fall 2013
Making It Linear or Linearization A simple trick for many models is to linearize the model in the independent variable. Introduction Section 0 Lecture 1 Slide 27 Refer to Baird Ch.5 and the associated homework problems. INTRODUCTION TO Modern Physics PHYX 2710 Fall 2004 Intermediate 3870 Lecture 5 Slide 27 LINEAR REGRESSION Fall 2013
Special Graph Paper Log-log paper tests for power law models. Semi-log paper tests for exponential models. Both Semi-log and log -log paper are handy for displaying details of data spread over many orders of magnitude. Linear Introduction Section 0 Lecture 1 Slide 28 Old School graph paper is still a useful tool, especially for reality checking during the experimental design process. Semilog INTRODUCTION TO Modern Physics PHYX 2710 Fall 2004 Log-Log Intermediate 3870 Lecture 5 Slide 28 LINEAR REGRESSION Fall 2013
Intermediate Lab PHYS 3870 Linear Regression Introduction Section 0 Lecture 1 Slide 29 References: Taylor Ch. 8 INTRODUCTION TO Modern Physics PHYX 2710 Fall 2004 Intermediate 3870 Lecture 5 Slide 29 LINEAR REGRESSION Fall 2013
Basic Assumptions for Regression Analysis We will (initially) assume: The errors in how hard you poke something (in the input) are negligible compared with errors in the response (see discussion in Taylor Sec. 9.3) The errors in y are constant (see Problem 8.9 for weighted errors analysis) The measurements of yi are governed by a Gaussian distribution with constant width y Introduction Section 0 Lecture 1 Slide 30 INTRODUCTION TO Modern Physics PHYX 2710 Fall 2004 Intermediate 3870 Lecture 5 Slide 30 LINEAR REGRESSION Fall 2013
Question 1: What is the Best Linear Fit (A and B)? Best Estimate of intercept, A , and slope, B, for For the linear model y = A + B x Intercept: Slope Introduction Section 0 Lecture 1 Slide 31 Linear Regression or Least Squares- Fit for Line INTRODUCTION TO Modern Physics PHYX 2710 where Fall 2004 Intermediate 3870 Lecture 5 Slide 31 LINEAR REGRESSION Fall 2013
Best Estimates of Linear Fit Consider a linear model for yi, yi=A+Bxi The probability of obtaining an observed value of yi is ?????,? ?1 ??= ?????,? ?1 ?????,? ?? ???? ?2/2? ????2 ?? (? + ???)2 To find the best simultaneous values for A and B, find the maximum Prob or minimum X2 ? 1 = ??2 ?=1 Best Estimates of A and B are from maximum probibility or minimum summation Solve for derivative wrst A and B set to 0 Minimize Sum Best estimate of A and B Introduction Section 0 Lecture 1 Slide 32 INTRODUCTION TO Modern Physics PHYX 2710 Fall 2004 Intermediate 3870 Lecture 5 Slide 32 LINEAR REGRESSION Fall 2013
Best Estimates of Linear Fit Best Estimates of A and B are from maximum probibility or minimum summation Solve for derivative wrst A and B set to 0 Minimize Sum Best estimate of A and B In a linear algebraic form This is a standard eigenvalue problem With solutions For the linear model y = A + B x Intercept: ? = Slope ?2 ? ? ?? ? ?2 ? 2 ?2 ? ?2 ? 2(Prob (8.16) ??= ?? Introduction Section 0 Lecture 1 Slide 33 ? = ? ?? ? ?? ? ?2 ? 2 ? ??= ?? ? ?2 ? 2 is the uncertainty in the measurement of y, or the rms deviation of the measured to predicted value of y INTRODUCTION TO Modern Physics PHYX 2710 1 ? 2 ?? ? + ???2 where ??= Fall 2004 Intermediate 3870 Lecture 5 Slide 33 LINEAR REGRESSION Fall 2013
Least Squares Fits to Other Curves a)Approaches (1)Mathematical manipulation of equations to linearize (2)Resort to probabilistic treatment on least squares approach used to find A and B b)Straight line through origin, y=Bx (1)Useful when you know definitely that y(x=0) = 0 (2)Probabilistic approach (3)Taylor p. 198 and Problems 8.5 and 8.18 Slope with uncertainty of measurements in y Introduction Section 0 Lecture 1 Slide 34 INTRODUCTION TO Modern Physics PHYX 2710 where Fall 2004 Intermediate 3870 Lecture 5 Slide 34 LINEAR REGRESSION Fall 2013
Least Squares Fits to Other Curves 1.Variations on linear regression a)Weighted fit for straight line (1)Useful when data point have different relative uncertainties (2)Probabilistic approach (3)Taylor pp. 196, 198 and Problems 8.9 and 8.19 Intercept: Slope Introduction Section 0 Lecture 1 Slide 35 INTRODUCTION TO Modern Physics PHYX 2710 Fall 2004 Intermediate 3870 Lecture 5 Slide 35 LINEAR REGRESSION Fall 2013
Least Squares Fits to Other Curves a) Polynomial (1) Useful when (a) formula involves more than one power of independent variable (e.g., x(t) = (1/2)a t2 + vo t + xo) (b) as a power law expansion to unkown models (2) References (a) Taylor pp. 193-194 (b) [Baird 6-11] Introduction Section 0 Lecture 1 Slide 36 INTRODUCTION TO Modern Physics PHYX 2710 Fall 2004 Intermediate 3870 Lecture 5 Slide 36 LINEAR REGRESSION Fall 2013
Fitting a Polynomial Extend the linear solution to include on more tem, for a second order polynomial This looks just like our linear problem, with the deviation in the summation replace by Introduction Section 0 Lecture 1 Slide 37 This leads to a standard 3x3 eigenvalue problem, INTRODUCTION TO Modern Physics PHYX 2710 Which can easily be generalized to any order polynomial Fall 2004 Intermediate 3870 Lecture 5 Slide 37 LINEAR REGRESSION Fall 2013
Least Squares Fits to Other Curves a) Exponential function (1) Useful for exponential models (2) linearized approach (a) recall semilog paper a great way to quickly test model (b) recall linearizaion (i) y = A e Bx (ii) z = ln(y) = ln A + B x = A + B x (3) References (a) Taylor pp 194-196 (b)Baird p. 137 Introduction Section 0 Lecture 1 Slide 38 INTRODUCTION TO Modern Physics PHYX 2710 Fall 2004 Intermediate 3870 Lecture 5 Slide 38 LINEAR REGRESSION Fall 2013
Least Squares Fits to Other Curves C.Power law 1.Useful for variable power law models 2. linearized approach a)recall log paper a great way to quickly test model b)recall linearizaion (1)y = A x B (2)z = ln A + B ln(x) = A + B w (a)z = ln(y) (b)w = ln(x) 3.References a)Baird p. 136-137 Introduction Section 0 Lecture 1 Slide 39 INTRODUCTION TO Modern Physics PHYX 2710 Fall 2004 Intermediate 3870 Lecture 5 Slide 39 LINEAR REGRESSION Fall 2013
Least Squares Fits to Other Curves D. Sum of Trig functions 1. Useful when a) More than one trig function involved b) Used with trig identities to find other models (1) A sin(w t+b) = A sin(wt)+B cos(wt) 2. References a) Taylor p.194 and Problems 8.23 and 8.24 b) See detailed solution below E. Multiple regression 1. Useful when there are two or more independent variables 2. References a) Brief introduction: Taylor pp. 196-197 3.More advanced texts: e.g., Bevington Introduction Section 0 Lecture 1 Slide 40 INTRODUCTION TO Modern Physics PHYX 2710 Fall 2004 Intermediate 3870 Lecture 5 Slide 40 LINEAR REGRESSION Fall 2013
Problem 8.24 Introduction Section 0 Lecture 1 Slide 41 INTRODUCTION TO Modern Physics PHYX 2710 Fall 2004 Intermediate 3870 Lecture 5 Slide 41 LINEAR REGRESSION Fall 2013
Problem 8.24 Introduction Section 0 Lecture 1 Slide 42 INTRODUCTION TO Modern Physics PHYX 2710 Fall 2004 Intermediate 3870 Lecture 5 Slide 42 LINEAR REGRESSION Fall 2013
Problem 8.24 Introduction Section 0 Lecture 1 Slide 43 INTRODUCTION TO Modern Physics PHYX 2710 Fall 2004 Intermediate 3870 Lecture 5 Slide 43 LINEAR REGRESSION Fall 2013
Problem 8.24 Introduction Section 0 Lecture 1 Slide 44 INTRODUCTION TO Modern Physics PHYX 2710 Fall 2004 Intermediate 3870 Lecture 5 Slide 44 LINEAR REGRESSION Fall 2013
Problem 8.24 Introduction Section 0 Lecture 1 Slide 45 INTRODUCTION TO Modern Physics PHYX 2710 Fall 2004 Intermediate 3870 Lecture 5 Slide 45 LINEAR REGRESSION Fall 2013
Intermediate Lab PHYS 3870 Correlations Introduction Section 0 Lecture 1 Slide 46 INTRODUCTION TO Modern Physics PHYX 2710 Fall 2004 Intermediate 3870 Lecture 5 Slide 46 LINEAR REGRESSION Fall 2013
Uncertaities in a Function of Variables Consider an arbitrary function q with variables x,y,z and others. Expanding the uncertainty in y in terms of partial derivatives, we have q q q + + + ( , , ,...) ... q x y z x y z x y z If x,y,z and others are independent and random variables, we have 2 2 2 q q q = + + + ( , , ,...) ... q x y z x x x x y z If x,y,z and others are independent and random variables governed by normal distributions, we have 2 2 2 q q q = + + + ... x x y z Introduction Section 0 Lecture 1 Slide 47 x y z We now consider the case when x,y,z and others are not independent and INTRODUCTION TO Modern Physics PHYX 2710 random variables governed by normal distributions. Fall 2004 Intermediate 3870 Lecture 5 Slide 47 LINEAR REGRESSION Fall 2013
Covariance of a Function of Variables We now consider the case when x and y are not independent and random variables governed by normal distributions. Assume we measure N pairs of data (xi,yi), with small uncertaities so that all xi and yi are close to their mean values X and Y. Expanding in a Taylor series about the means, the value qi for (xi,yi), ??= ? ??,?? ?? ? ? ,? +?? ?? ?? ? +?? Note partial derivatives are all taken at X or Y and are hence the same for each i ?? ?? ? We then find the simple result for the mean of q ? =1 0 0 ? ? =1 ? ? ? ,? +?? ?=1 ?? ?? ? +?? ?????? ? = ? ? ,? ?? ?? ? ? ?? ?=1 The standard deviation of the N values of qi is ? ??2=1 Introduction Section 0 Lecture 1 Slide 48 ? ?? ? 2 ?=1 ? 2 INTRODUCTION TO Modern Physics PHYX 2710 ??2=1 ?=1 ? ?? ?? ?? ? +?? ?? ?? ? Fall 2004 Intermediate 3870 Lecture 5 Slide 48 LINEAR REGRESSION Fall 2013
Covariance of a Function of Variables The standard deviation of the N values of qi is ? ??2=1 ? ?? ? 2 ?=1 ? 2 ??2=1 ? ?? ?=1 ?? ?? ? +?? ?? ?? ? ? ? ? 21 ? ?? ? 2+ ?? ?=1 21 ? ?? ? 2+ 2 ?? ?=1 ??2= ?? ?? ?? 1 ?? ? ?? ? ?=1 ?? ?? ?? ? 2 2 ??2= ?? ??2+ ?? ??2+ 2 ?? ?? ?? ??? ?? ?? ?? 1 ? ? ?=1 ?? ? ?? ? with ??? Introduction Section 0 Lecture 1 Slide 49 If x and y are independent INTRODUCTION TO Modern Physics PHYX 2710 Fall 2004 Intermediate 3870 Lecture 5 Slide 49 LINEAR REGRESSION Fall 2013
Schwartz Inequality Define a function ? ? ? 1 ? ?? ?+ ? ?? ?2 ?=1 0 ? ? 0, since the function is a square of real numbers. Using the substitutions ?? ?? ? 2 ?=1 1 ? ?=1 ? ? = ??2+ 2????+ ?2??2 0 Now find t for which A(tmin) is a minimum: ?? ? ?? Show that 1 ? ? Eq. (4.6) ? ?? ? ?? ? ??? Eq. (9.8) See problem 9.7 = 0 = 2???+ 2???? ??2 ????= ??? ??2 Then since for any t, ? ? 0 ???? ????= ??2+ 2??? ??? ??2 2??2 0 2 0 0 + ??? ??2 2+ ???/?? ?? ??? ?? = ??2 2???/?? = ??+ ??? ?? Multiplying through by ??2 0 which is true if ??2??2 ???2 0 ??2??2 ???2 Now, since by definition ??> 0 and ??> 0, ???? ??? , QED = ????+ ??? ???? ??? 0 Introduction Section 0 Lecture 1 Slide 50 INTRODUCTION TO Modern Physics PHYX 2710 Fall 2004 Intermediate 3870 Lecture 5 Slide 50 LINEAR REGRESSION Fall 2013


 Errors")


 Uncertaities and")


?")