Migration from Sub-Saharan Africa to EU Member States: Economic Well-Being Prospects

Mobility is intrinsic to human nature, with international migration being influenced by policy and economic barriers. This study explores migration flows from Sub-Saharan Africa to the EU, analyzing the impact on economic well-being. Research objectives include examining asylum applicants' patterns and the relationship with institutional, political, economic, and social frameworks in EU host countries.

Download Presentation

Please find below an Image/Link to download the presentation.
The content on the website is provided AS IS for your information and personal use only. It may not be sold, licensed, or shared on other websites without obtaining consent from the author. Download presentation by click this link. If you encounter any issues during the download, it is possible that the publisher has removed the file from their server.
E N D
Presentation Transcript
Migration from Sub Migration from Sub- -Saharan Africa the EU Member States: the EU Member States: Do the Prospects for Better Economic Well Do the Prospects for Better Economic Well- -Being Matter? Saharan Africa s Countries to s Countries to Being Matter? Eva Kov ov Faculty of Economics V B Technical University of Ostrava Czech Republic
Introduction Introduction Mobility is one of the universal features of human species. People have been migrating since the beginning of time. Because of existence of international borders, migration is not considered a matter of course in presence as in the past. Policy and economic barriers existing in current world constrained natural human ambition to reach better living conditions. If people are mobile in industrial countries, one usually speaks enthusiastically about flexible labour markets (Ellis, 2003), and whole migration between developed countries is considered to be natural process. However, migration to developed countries from the less developed ones is usually interpreted in negative terms. If the international migration is discussed by the general public, it is usually understood in terms of migration from developing countries to rich countries in Europe and North America. This misleading interpretation is based on the fact that on average three quarters of international migrants come to a country with a higher level of human development than their country of origin has. South-North migration flows represent only one third of international migration.
Research Motivation and Objectives Research Motivation and Objectives In recent years, the number of immigrants coming to Europe has increased in dramatic way including both refugees and economic migrants (Nov , 2016). They come from two regions, located not far from Europe Middle East and Sub-Saharan Africa. Immigrants coming from the former one are usually considered (with regard to the actual insecurity there) refugees that need special treatment. Those coming from the latter one are usually considered economic migrants wanting to obtain social benefits offered in the European Union Member States. However, in many cases, people coming to the EU from Sub-Saharan Africa are eligible to obtain refugee status. The main objectives of my research are to identify fundamental patterns of Sub- Saharan Africa-EU migration flows and to examine relations between the number of asylum applicants registered in EU Member States and existing institutional, political, economic and social framework in EU countries hosting the largest proportion of Sub-Saharan Africa s immigrants.
Definitions Definitions Asylum Applicant - First Time Asylum Applicants - APs First-time asylum applicants for international protection (as defined by Article 2(h) of Qualification Directive 2011/95/EU) are persons who lodged an application for asylum for the first time in a given Member State during the reference period. The term 'first-time' implies no time limitation and therefore person can be recorded as first-time applicant only if he or she had never applied for international protection in the reporting country in the past, irrespective of the fact that he is found to have applied in another Member State of the European Union. Sub-Saharan Africa SSA Sub-Saharan Africa is quite frequent term used in various circumstances. However, each researcher covers different number of states with this regional or socio- economic designation. Eurostat does not recognize explicitly for statistical purposes Sub-Saharan Africa. In the paper, own definition of SSA is applied and this term covers 49 countries (all African countries besides Egypt, Libya, Algeria, Tunisia, Morocco). Economic Well-Being GDP per capita, incomes, jobs and earnings material living conditions (see definition of well-being index introduced by OECD or the report of Stiglitz, Sen, Fitoussi).
Asylum Applicants in the EU Asylum Applicants in the EU Total number of asylum applications registered in the EU 28 Member States has increased in recent years. However, in the 1990s, the EU faced similar phenomenon. Because of political crises and armed conflicts, number of new asylum applications started to grow in 1987, where the peak was reached in 1992 when EU 15 Member States registered about 700 thousand applications. In the second half of the 1990s, number of application permanently declined. Between years 1998 and 2003, EU 15 Member States recorded from 300 to 400 thousands asylum applicants annually. Since 2004, significant drop was monitored and the EU 27 Member States registered 192 300 new asylum applications in 2006. Between years 2008-2012, total number of asylum applications submitted in the EU Member States was growing slowly because of increased migration especially from unstable Middle East, and poor Sub-Saharan Africa. Year over year changes in the number of registered asylum seekers started to grow in 2013. In 2014, the EU recorded more than 600 thousand asylum applicants and in 2015 their number doubled to 1,300 thousand. However, beginning of the refugee crisis was evident worldwide. In 2015, every minute 30 people had to flee from their homes. 55 % of all refugees worldwide came from three countries Syria (5.5 million), Afghanistan (2.5 million) and South Sudan (1.4 million).
Asylum Applicants in the EU Asylum Applicants in the EU Number of Asylum Applicants in EU countries 1,400,000 120.00 1,200,000 100.00 1,000,000 80.00 800,000 60.00 600,000 40.00 400,000 20.00 200,000 0.00 0 -20.00 2008 2009 2010 2011 2012 2013 2014 2015 2016 Number of aplications Percentage change (YoY) Asylum Applicants from SSA and Total Number of Asylum Applicants from Third Countries 2008 2009 2010 2011 2012 2013 2014 2015 2016 Total number of APs Number of APs from SSA Percentage share 225 150 263 835 259 400 309 040 335 290 431 090 626 960 1 322 825 1 259 955 68 595 75 650 61 660 84 435 72 925 97 000 152 245 167 315 219 330 30.47 % 28.67 % 23.77 % 27.32 % 21.75 % 22.50 % 24.28 % 12.65 % 17.41 % Source: Eurostat (2017), own data processing
First First Time Time Asylum Applicants in the EU Asylum Applicants in the EU from fromSSA SSA Total Number of First Time Asylum Applicants Coming to the EU Member States from SSA Countries 250,000 70.00 Number of Asylum Applicants in the EU 210,840 60.00 192,720 Year over Year changes (in %) 200,000 50.00 169,645 40.00 143,870 150,000 30.00 20.00 87,835 100,000 10.00 77,095 65,385 64,020 0.00 55,255 53,440 50,000 -10.00 -20.00 0 -30.00 2008 2009 2010 2011 2012 2013 2014 2015 2016 2017 Year Number of Aps YoY changes (%) Source: Eurostat (2018), own data processing
First First Time Time Asylum Applicants in the EU Asylum Applicants in the EU from fromSSA SSA TOP 5 Countries of Origins of Asylum Applicant Coming to the EU from SSA Top 5 countries of origin of APs in EU No. SSA countries with more than 1 000 APs in EU Total no. APs in EU Year 1st No. Aps 2nd No. Aps 3rd No. Aps 4th No. Aps 5th No. Aps 2008 2009 2010 2011 2012 2013 2014 2015 2016 2017 Somalia Somalia Somalia Nigeria Somalia Somalia Eritrea Eritrea Nigeria Nigeria Nigeria 15 255 16 865 12 920 12 225 12 850 14 715 36 250 33 115 46 255 39 105 185 560 Nigeria Zimbabwe Nigeria Somalia Congo DR Eritrea Nigeria Nigeria Eritrea Eritrea Eritrea 8 970 7 825 5 435 10 600 7 475 13 920 18 895 30 025 33 370 24 370 169 080 Eritrea Nigeria Congo DR Congo DR Nigeria Nigeria Somalia Somalia Somalia Guinea Somalia 6 930 7 735 5 000 5 795 6 725 10 190 14 805 19 610 18 975 17 730 149 325 Zimbabwe Eritrea Guinea Eritrea Eritrea Congo DR Mali Gambia Gambia 4 730 4 990 4 440 5 575 6 235 7 505 12 790 12 225 15 725 14 020 67 390 Ghana Congo DR Eritrea Guinea Guinea Mali Gambia Sudan Guinea Somalia Gambia 2 515 4 180 4 325 5 560 4 480 6 425 11 315 10 920 13 465 12 730 60 595 55 255 64 020 53 440 77 095 65 385 87 835 143 870 169 645 210 840 192 720 1 120 105 10 14 12 18 16 16 14 17 20 20 /// C te d'Ivoire Guinea 2008-2017 Source: Eurostat (2018), own data processing
First First Time Time Asylum Applicants in the EU Asylum Applicants in the EU from fromSSA SSA TOP 5 EU Countries Hosting Largest Number of AsylumApplicants Coming from SSA Top 5 hosting countries of APs from SSA Share of top 5 in total number of Aps Year 1st No. Aps 2nd No. Aps 3rd No. Aps 4th No. Aps 5th No. Aps United Kingdom 2008 Italy 21 490 12 150 Sweden 5 200 Netherlands 5 135 Belgium 3 150 85.29 United Kingdom Netherland s Netherland s 2009 13 880 France 12 780 Italy 9 435 Sweden 8 140 7 705 81.11 United Kingdom 2010 France 14 810 Sweden 8 285 7 835 Germany 5 875 5 295 78.75 United Kingdom United Kingdom 2011 Italy 25 095 France 17 380 Sweden 7 145 6 645 Belgium 6 555 81.46 2012 France 17 055 Sweden 10 235 Italy 7 730 6 785 Germany 6 575 74.03 United Kingdom United Kingdom United Kingdom 2013 France 18 945 Germany 17 050 Italy 14 450 Sweden 9 920 6 995 76.74 2014 Italy 40 645 Germany 33 280 France 20 510 Sweden 17 250 9 445 84.19 2015 Italy 50 375 Germany 35 035 France 24 115 Sweden 14 555 11 965 80.25 United Kingdom United Kingdom United Kingdom 2016 Italy 84 075 Germany 68 825 France 26 420 7 785 Belgium 4 140 90.72 2017 Italy 86 995 Germany 42 655 France 30 515 4 330 Belgium 4 330 87.56 2008-2017 Italy 343 555 Germany 220 470 France 182 530 90 890 Sweden 87 710 82.60 Source: Eurostat (2018), own data processing
First First Time Time Asylum Applicants in the EU Asylum Applicants in the EU from fromSSA SSA Specified Groups of EU Member States Source: Eurostat (2018), own data processing Country group 2008 2009 2010 2011 2012 2013 2014 2015 2016 2017 2008-2017 V4 110 80 105 185 360 2 905 1 520 5 935 625 85 11 910 EU6 32 635 37 480 34 350 57 085 40 170 58 250 104 405 124 165 187 075 168 570 844 185 EU15 52 425 61 395 52 925 75 075 62 875 81 955 141 395 163 165 209 010 191 560 1 091 780 EU13 2 825 2 640 535 2 045 2 475 5 820 2 485 6 370 1 805 1 245 28 245 Czech Republic Hungary Poland Slovakia 70 50 45 35 10 15 40 25 35 25 30 30 0 0 0 0 0 2 765 1 415 5 890 575 15 40 30 30 30 70 80 45 35 90 40 25 20 0 0 305 0 0 0 Number of Asylum Applicants in V4 countries in the period 2008-2017 Czech Republic Hungary Poland Slovakia
Relation Between Preconditions for better Relation Between Preconditions for better Economic Well Economic Well- -Being and Number of Asylum Being and Number of Asylum Applicants Applicants Is this relation significant at the first sight?
GDP per capita Versus Number of Asylum Applicants 400,000 Average value for EU28 IT Number of Asylum Applicants (average number 2008-2017) 350,000 300,000 250,000 DE 200,000 FR 150,000 SE UK 100,000 BE NL 50,000 DK FI IE LU AT 0 0.0 10 000.0 20 000.0 30 000.0 40 000.0 50 000.0 60 000.0 70 000.0 80 000.0 90 000.0 GDP per capita (euro, average 2008-2017) Source: Eurostat (2018), own data processing
Median Net Income per capita Versus Number of Asylum Applicants Average value for EU28 400,000 IT 350,000 Number of Asylum Applicants (average 2008-2016) 300,000 250,000 DE 200,000 FR 150,000 UK SE 100,000 BE 50,000 NL AT DK IE FI CY LU 0 0.0 5 000.0 10 000.0 15 000.0 20 000.0 25 000.0 30 000.0 35 000.0 Median equaliset net income (euro, average 2008-2016) Source: Eurostat (2018), own data processing
Social Benefits per capita Versus Number of Asylum Applicants 400,000 Average value for EU28 IT 350,000 Number of Asylum Applicants (average 2008-2017) 300,000 250,000 DE 200,000 FR 150,000 UK SE 100,000 BE NL 50,000 AT DK IE FI LU 0 0.0 2 000.0 4 000.0 6 000.0 8 000.0 10 000.0 12 000.0 14 000.0 16 000.0 Social benefits (PPS, euro per capita, average 2008-2015) Source: Eurostat (2018), own data processing
Risk of Poverty Prevalence Versus Number of Asylum Applicants Average value for EU28 400,000 IT 350,000 Number of Asylum Applicants (average, 2008-2017) 300,000 250,000 GR 200,000 FR 150,000 UK SE 100,000 BE NL 50,000 DK FI CZ 85 0 0.0 5.0 10.0 15.0 20.0 25.0 30.0 35.0 40.0 45.0 50.0 People at risk of poverty or social exclusion (percentage, average 2008-2016) Source: Eurostat (2018), own data processing
Activity Rate of the Citizens with Non-EU Country of Birth Versus Number of Asylum Applicants 400,000 Average value for EU28 IT 350,000 Number of Asylum Applicants (average, 2008-2017) 300,000 250,000 DE 200,000 FR 150,000 UK SE 100,000 BE NL 50,000 CZ PT 0 0.0 10.0 20.0 30.0 Activity rate (percentage, average 2013-2017) 40.0 50.0 60.0 70.0 80.0 90.0 Source: Eurostat (2018), own data processing
Brief Brief Summary Summary In case of GDP p.c., median net income p.c., social benefits p.c., the largest number of asylum applicants is registered in countries with above EU28 average values of defined indicators, but not in countries with the highest values. In case of poverty, the largest number of asylum applicants is not registered in countries with the lowest risk of poverty. In case of activity rate, the largest number of asylum applicants is not registered in countries with the highest activity rates of their non-EU28 workers. At the first sight, relation between the number of asylum applicants and preconditions for better well-being is not so significant further research of the relation between preconditions for immigrants aspirations for better well-being will be examined and it will be opened with the examination of the immigrants integration frameworks existing within the social systems in hosting EU countries.
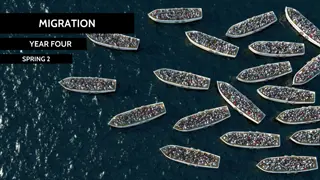
References References: : Introductory and final photo: UN Refugees and Migrants (2016). More than 28 million children uprooted by conflict and face further dangers UNICEF report [online]. [cit.2018-05-02]. Available at: https://refugeesmigrants.un.org/more-28-million-children-uprooted-conflict-and-face- further-dangers-%E2%80%93-unicef-report. Data: Eurostat (2017-2018). Statistics [online]. [cit.2017-9-22]. Available at: http://ec.europa.eu/eurostat/data/database. Background studies for research motivation: Clemens, Michael (2014). Does Development Reduce Migration? Working paper No 359. Washington: Center for Global Development. De Hass, Hein (2010). Migration and Development: A Theoretical Perspective. International Migration Review, vol. 44, nr. 1, pp. 227-264. De Hass, Hein (2011). Development lead to more migration [online]. [cit.2017-05-06]. Available at: https://www.unrefugees.org/refugee-facts/what-is-a-refugee/. Ellis, Frank (2003). A Livelihoods Approach to Migration and Poverty Reduction. Paper commissioned by the Department for International Development (DFID), Norwich, UK.
Thank you for your attention. Thank you for your attention. eva.kovarova@vsb.cz