Understanding Image Display and Halftoning Techniques

Images are reproduced for display on various devices like televisions, computer monitors, and newspapers with specific characteristics such as pixel shape, spatial resolution, and color depth. Issues with display devices, such as pixel resolution and color depth, affect fidelity. Halftoning methods, including analog halftoning, are used to simulate higher color depth on output devices with lower capabilities.

Download Presentation

Please find below an Image/Link to download the presentation.
The content on the website is provided AS IS for your information and personal use only. It may not be sold, licensed, or shared on other websites without obtaining consent from the author. Download presentation by click this link. If you encounter any issues during the download, it is possible that the publisher has removed the file from their server.
E N D
Presentation Transcript
Image Printing and Display Reproducing reality
Display Images are meant to be viewed Television screen Computer monitor Cell phone display Newspaper Glossy magazine Overhead projector Display device will be characterized by pixel shape spatial resolution color depth
Issues with Display A typical computer monitor will use square pixels with a spatial resolution of 72 pixels per inch and a color depth of 32 bpp. A black-and-white laser printer may use circular pixels with a resolution of 1200 pixels per inch and a color depth of 1 bpp. Whenever a digital image is rendered for display, the characteristics and limitations of the output device must be considered in order to generate an image of sufficient fidelity.
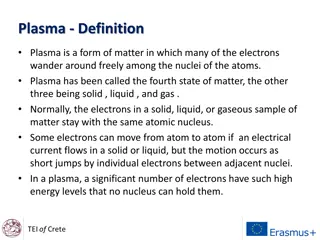
Halftoning The central problem when printing is color depth of the output device. How to achieve the illusion of large color depth using output devices of low color depth? Color printers typically have 4 colors (CMYK) or 2 bpp. Laser printers have 1 color (1 bpp) Halftoning is the process of reducing the color depth of a source image to the level of the output device while maintaining the illusion that the output device has the same color depth as the source. The eye integrates Generally buy color depth at the cost of resolution
Analog Halftoning In traditional, analog halftoning, a grayscale image is converted into a binary image composed of a pattern of dots. The dots are arranged in a grid and are themselves of various sizes. Figure 8.1 shows how black dots of various sizes printed on a white background can give the visual illusion of all shades of gray when viewed from an appropriate distance. The 8-bit grayscale gradient of (a) is halftoned to a 1-bit approximation. While appearing to be a grayscale image, the image of part (b) is a 1 bpp halftone as depicted by the highlighted inset. Halftoning in this example gives a 1-bit output device the illusion of being an 8-bit device.
Analog Halftoning Traditional halftoning is a continuous domain or analog process that is performed by projecting an image through an optical screen onto film. The surface of the optical screen is etched with lines in such a way as to cause dots to appear on the film in correspondence with the source intensity. Larger black dots appear in regions of dark intensity and smaller black dots in regions of bright intensity. The spatial resolution of halftone systems is given as lines per inch (LPI), which measures the density of the etched lines on the optical screen. Newsprint, for example, is typically printed at 85 LPI while glossy magazines are printed using 300 LPI halftone screens.
Digital Halftoning Digital halftoning, also known as dithering, is any binary process that reduces the color depth of a source while maintaining the sources spatial resolution. A binary process is any process that outputs one of two colors for every pixel. Digital halftoning differs from traditional halftoning since the digital halftoning process is discrete and the spatial resolution of the source image and the output device are uniform. Traditional halftoning takes place in the continuous domain and the spatial resolution of the output device is flexible since dot sizes are allowed to vary continuously. The output device normally has a color depth of 1 bpp; hence the task is to convert a grayscale image into a binary image of the same dimensions.
Dithering The human visual system performs spatial integration (averaging) of colors near the point of focus and hence the central idea of dithering is to ensure that the local average of all output samples is identical to its corresponding source sample. Dithering increases the apparent color depth of an output device by carefully intermingling colors from some limited palette in such a way that when local regions are averaged they produce the desired colors. Figure 8.2 left: various shades of gray generated by interweaving only black and white, Figure 8.2 right: various shade of green generated by interweaving only cyan and yellow.
Thresholding A dithering technique. Generate a black or white sample from an 8-bit source sample. A point processing technique The dimensions of the destination are the same as the source The result is dependent on the threshold The output must be binary and hence each source sample is converted to either black or white by comparison to a threshold value tau. 9
Thresholding Thresholding rarely produces pleasing results and is solely dependent on proper selection of the threshold value. The threshold is commonly set to the center of the source image s dynamic range, which for an 8-bit image equates to 128. While this threshold value is appropriate as a generic solution it does not produce good results in many cases. Figure 8.3 illustrates the effect of choosing an incorrect threshold. An overexposed source image is thresholded with a cutoff of 128 to obtain the binary image of (b). Nearly all of the grayscale values in the source exceed 128 and hence nearly all of the resulting binary output samples are converted to white. Choosing a threshold of 196 produces much better results as can be seen in Figure 8.3(c). 10
How to choose a good threshold? Adaptive thresholding, also known as dynamic thresholding, is used to determine an appropriate threshold for a particular image. Adaptive thresholding is typically based on a statistical analysis of an image s histogram, and seeks to determine an optimal split between clusters of samples in the data distribution. The simplest adaptive thresholding technique is to use either the average or median value of all source samples as the threshold. Computing both the average and mean sample values requires one pass through the image data and hence incurs a small amount of overhead.
How to choose a good threshold? A more sophisticated alternative is to use is an iterative technique uncovered by Ridler and Calvard. This algorithm locates a threshold that is midway between the means of the black and white samples in the histogram. Listing 8.1 gives a pseudocode description of the algorithm.
Local Thresholding Thresholding can also be done locally This is a regional process Compute a threshold that is distinct for each individual sample. The threshold is the average of the samples in the region Emphasizes local contrast but looses global contrast 13
Patterning Substitute a pattern for each source pixel Each pattern corresponds to a single intensity level (the average of the samples in the pattern) For an NxN pattern, there are N*N + 1 possible intensity levels The destination is N times larger than the source in width AND height Consider the following 3x3 font pattern 14
Patterning Generates a binary image from a grayscale or color source by increasing the resolution of the output in order to compensate for the decreased color depth. Patterning works by using a group of pixels in the display device to represent a single pixel from the source image. The font patterns must be carefully chosen to avoid artificial patterns from forming An NxN pattern can represent NxN+1 patterns. The font below is a clustered-dot pattern. Each pattern in the sequence is obtained by changing one pixel Each pattern is a subset of the previous in the sequence
Patterning Example G = (P P%26)/26 1 2 3 4 4 5 8 8 9 33 64 92 113 234 121 219 133 245 Source image pixels scaled to the corresponding font value binary output image 16
Patterning 17
Random Dithering Random dithering, as its name implies, chooses the threshold value at random from a uniform distribution of values in the dynamic range of the source. This technique does maintain both the global intensity value and local intensity values over reasonably small neighborhoods. Consider a grayscale image having an average grayscale intensity of 100. On average, the randomly selected threshold will fall below the pixel value approximately 100 out of every 255 samples, thus generating a white output, while about 155/255 percent of the thresholds will be above the pixel value and hence will likely generate a black output, thus maintaining the proper average intensity value at any dimensional scale. Digital random thresholding is similar to a high quality printmaking technique known as mezzotinting. An artist roughens the surface of a soft metal printing plate with thousands of small randomly located depressions or dots. The density of the dots within a local region determines the tonality of the print. When the plate is covered with ink and pressed against canvas or paper, those regions with a high dot density produce areas of less intensity than those areas with few or no dots. random!
Dithering Matrices A dither matrix is a rectangular pattern of threshold values that seeks to produce optimal output for a local region of the source. When dithering a WxH source image with a NxN dither matrix, the dithering matrix is generally much smaller than the source and is therefore repetitively tiled to generate threshold values for every source sample. Dither matrices correspond to pattern fonts since the thresholds generally correspond to the likelihood of a black pixel occurring in any one of the fonts. Dither matrices are generally square and must be scaled to the color depth of the source.
Dither Matrix Example 33 0 45 128 88 123 200 210 222 255 255 0 45 51 64 93 113 173 221 233 240 0 0 192 12 61 87 120 188 200 235 254 3 43 73 152 193 199 221 223 0 23 55 135 199 200 210 201 0 10 21 110 183 173 198 177 0 3 2 32 18 98 100 123 0 0 0 1 12 33 73 110 Position the dither matrix at the upper-left and compute the outputs using matrix entries as threshold values. 23
Dither Matrix Example 88 0 123 128 33 45 200 210 222 255 255 0 255 0 45 51 93 192 113 64 173 221 233 240 0 0 0 255 12 61 87 120 188 200 235 254 3 43 73 152 193 199 221 223 0 23 55 135 199 200 210 201 0 10 21 110 183 173 198 177 0 3 2 32 18 98 100 123 0 0 0 1 12 33 73 110 Move the matrix and repeat. 24
Dither Matrix Example 200 0 210 128 33 45 88 123 222 255 255 0 255 0 255 255 45 51 93 113 173 192 221 64 233 240 0 0 0 255 0 255 12 61 87 120 188 200 235 254 3 43 73 152 193 199 221 223 0 23 55 135 199 200 210 201 0 10 21 110 183 173 198 177 0 3 2 32 18 98 100 123 0 0 0 1 12 33 73 110 Move the matrix and repeat. 25
Dithering 3x3 Ordered Dither 4x4 Ordered Dither 26
Error Diffusion The error between the source and destination is used to adjust the threshold as the source image is scanned The error is then pushed into unprocessed nearby samples in order to make sure that the correct percentage of black/white pixels are generated locally. 27
Floyd-Steinberg Diffusion Various ways of diffusing the error Floyd-Steinberg takes the error and distributes it using the ratios given below Remember that we are doing a raster scan. Samples above and to the left have already been processed. 28
Floyd-Steinberg Example 35 89 95 132 0 ? ? ? 68 112 100 150 ? ? ? ? 51 45 98 127 ? ? ? ? 35 89 95 132 35 104 95 132 15 35/16 = 2.1875 68 112 100 150 79 114 100 150 11 2 51 45 98 127 51 45 98 127 29
Floyd-Steinberg Example 35 104 95 132 0 0 ? ? 79 114 100 150 ? ? ? ? 51 45 98 127 ? ? ? ? 46 35 104 95 132 35 104 141 132 104/16 = 6.5 20 33 6 79 114 100 150 99 147 106 150 51 45 98 127 51 45 98 127 30
Floyd-Steinberg Example 35 104 141 132 0 0 255 ? 99 147 106 150 ? ? ? ? 51 45 98 127 ? ? ? ? -50 35 104 141 132 35 104 141 82 -114/16 = -7.125 -21 -36 -7 99 147 106 150 99 126 70 143 51 45 98 127 51 45 98 127 31
Floyd-Steinberg Example The sum of all gray levels in the input is 1102. The sum of all values in the output is 1020. The average per-pixel error is 6.83 Input Image Output Image 35 89 95 132 0 0 255 0 68 112 100 150 0 255 0 255 51 45 98 127 0 0 0 255 Note that this is not an in-place algorithm. Extra storage is required! (i.e. copy the input image and then manipulate the copy) 32
Other diffusion techniques Other techniques diffuse the error using different weights or ratios. The black square corresponds to the source sample being processed 33
Error Diffusion Examples Floyd-Steinberg Jarvis-Judice-Ninke 34
Error Diffusion Examples Stucki Sierra 35
What about color images? How to reduce a 24 bpp image to a 1 bpp? Extract the brightness band and halftone it. How to reduce a 24 bpp image to N bpp? Some devices have only 4 colors (CMYK color printers) Some devices have only 216 or 256 total colors available Thin web clients and web-safe palette (216 colors) Conversion to an indexed color model would limit to 256 colors Can use error diffusion!
Color Dithering Given a color palette (i.e. the colors supported by the output device) perform a color dither. 37
Stucki with 8 color palette Stucki with 16 color palette
Source image Stucki with web-safe palette
Color Dithering GIF images contain at most 256 different colors Uses an indexed color model of sorts The image has been dithered What if a GIF image is being viewed on a system that supports a color palette of 64 colors? What if the viewers color palette is different that GIF s color palette? The image is dithered twice and quickly deteriorates. GIF images are highly compressed, but lack quality! GIF Dither Display Dither 41
Color Dithering Dithering assumes a pre-defined palette that corresponds to the ability of the output to reproduce colors Consider GIF files Must construct an arbitrary palette of 256 colors Must then perform color dithering What is the optimal palette? 42
Median Cut Median cut A clustering algorithm Used to identify clusters of data points Used in the context of color palettes, identifies N clusters of colors in some color space Find the smallest box which contains all the colors in the image Find the box having the longest length on any one side Sort the colors in the box along the longest box axis. Split the box into 2 at the median of the sorted list. Repeat until the original color space has been divided into n boxes. Each box represents a color. The color is the average color of all contained colors 43
Median Cut algorithm createPalette(Image IM, int PaletteSize) B = smallest bounding box of all colors in IM PQ = new PriorityQueue() PQ.add(B, B.maxDimension()) while(PQ.size() != PaletteSize) { B = PQ.remove(); (B1,B2) = B.cut(); PQ.add(B1,B1.maxDimension()) PQ.add(B2,B2.maxDimension()) } return PQ.toArray(); } 44


")
")