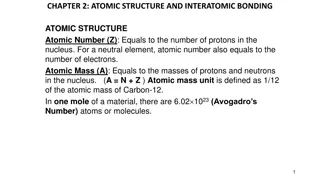
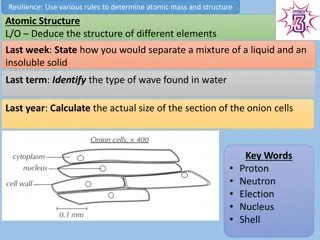
Understanding Average Atomic Mass Calculation

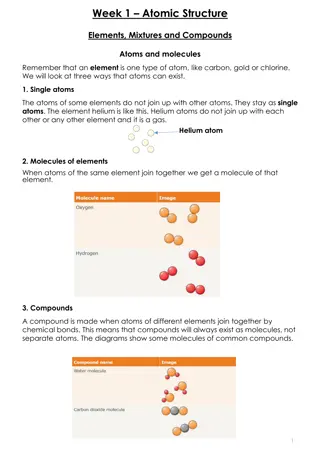
Dive into the concept of calculating average atomic mass through fractional and percentage abundances of isotopes. Practice examples with carbon and mercury isotopes to grasp the methodology effectively.

Download Presentation

Please find below an Image/Link to download the presentation.
The content on the website is provided AS IS for your information and personal use only. It may not be sold, licensed, or shared on other websites without obtaining consent from the author. Download presentation by click this link. If you encounter any issues during the download, it is possible that the publisher has removed the file from their server.
E N D
Presentation Transcript
I know its Mondaybut try to act as if its okay .
Oooh %^&*!! Mini-Quiz 2
Why the chemists C lists 12.01 and not 12 Imagine `fishing out 100 atoms of Carbon from a sample of graphite (pure carbon). What would you catch ? # p # n mass # caught out of 100 C atoms 6 6 12 6 7 13 Both kinds isotopes of C act exactly the same, chemically so chemists just average the masses 99 1 Average mass of each C=99*12 + 1*13 = 12.01 100
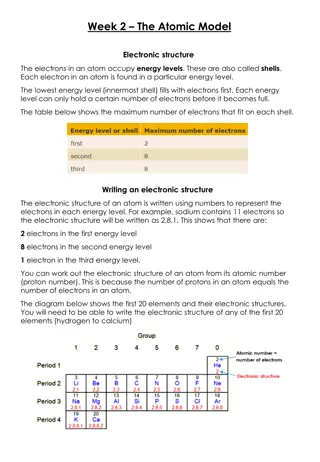
Averages Written As Sums Of Fractional Contributions 99*12 + 1*13 100 =99 *12 + 1 * 13 100 100 =f12*12 + f13*13 Average mass = of each C = 12.01 fm = fraction of C atoms with mass M
Averages written as sums of % contributions Average mass of each C =99 *12 + 1 * 13 100 100 =(99 % *12 + 1% * 13) 100 = (P12*12 + P13 *13) 100 Pm = % of C atoms with mass M
Take home lesson : Average mass is computable from fractional abundances fk and mk so: AV. MASS =f1*m1+f2*m2+ .. Or, from % abundances Pk and mk so: AV. MASS =P1*m1+P2*m2+ .. 100
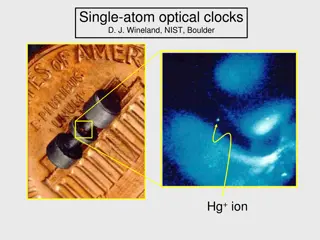
In- class example with mercury: Compute the average mass of Hg from abundance data # p #n Isotope mass, mk 80 118 198 Pk mk *Pk 1881 9.5 Sum= 20057 3144 80 119 199 15.8 5720 80 120 200 28.6 2492 5555 80 121 201 12.4 80 122 202 27.5 1246 80 124 204 6.2
AV. MASS =P1*m1+P2*m2+.. 100 Average mass of Hg =20057 =200.57 100
One more `U-Do-it Example: Boron Isotope P= % abundance 11B 81% 10B 19% Average B mass ??? AV. MASS =P1*m1+P2*m2+ .. 100 =81*11 + 19*10 100 =10.81
In Case you arent exhausted: estimate average atomic masses for elements below Isotope ~mass % abundance ~ average mass 1H 2H 1.008 2 .014 0.015 99.985 1.008 28Si 27.98 29Si 28.98 30Si 29.97 3.0 92.2 4.8 28.081 35Cl 34.97 37Cl 36.97 24.2 75.8 35.454
Dividing Up the Periodic Table: The Big Three Metalloids Non- Metals Metals
Geography of Periodic Table see also: text pages 14 see also: text pages 14 - -16 (use blank tables provides to label these 16 (use blank tables provides to label these regions) regions) Main group elements Noble metals Alkaline earth metals Ag, Au, Pt (Cu) Noble gases Transition metals lanthanides actinides halogens Alkali metals Know where metals, metalloids metals, metalloids and non metals metals are Know names of regions in yellow boxes too non
In-Class Point-to-it Periodic Table Geography Practice
U-PICK : Which categories of element type do each of the elements fall into here ? Symbol Main group element Transition element Metal Metalloid Alkali metal Alkaline earth metal Halogen Noble Gas X Na Cu Si Cl X X X X X X X
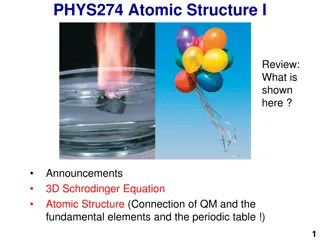
1912 : Ernst Rutherford is the `Manand presides over the `Golden Age of Experimental Physics THE ATOM APPEARS CONQUERED vintage Rutherford: All science is either Physics or stamp collecting.
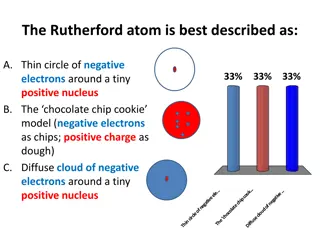
But there are 2 BIG Problems with Rutherford s model 1)Why don t the p+ and e-attract and come together ??? (or why isn t Earth the size of a golf ball?) ???
Rutherford atoms problems (continued) 2)Why doesn t the sun show all colors (e.g. show white light) when telescopes record spectrum? Diffraction grating divides up light colors ??? Why only few really strong lines