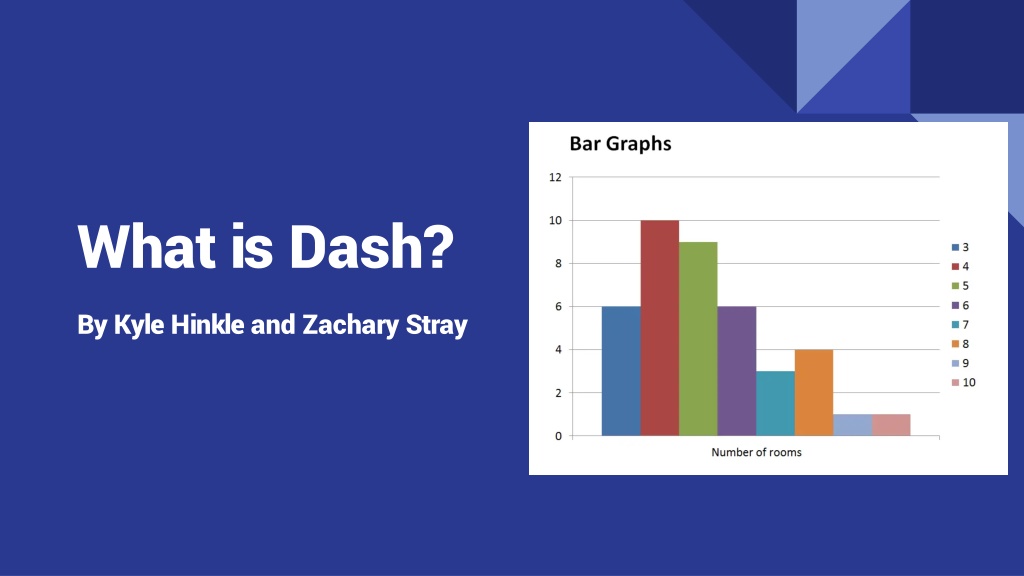
What is Dash?. By Kyle Hinkle and Zachary Stray
Dash, created by Plotly, provides a simple way to build web-based analytical applications without the need for advanced web development knowledge. It leverages Python skills and a combination of Flask, React.js, and Plotly.js to streamline the process of creating interactive data visualizations in real-time.
Download Presentation
Please find below an Image/Link to download the presentation.
The content on the website is provided AS IS for your information and personal use only. It may not be sold, licensed, or shared on other websites without obtaining consent from the author. Download presentation by click this link. If you encounter any issues during the download, it is possible that the publisher has removed the file from their server.

Presentation Transcript
What is Dash? By Kyle Hinkle and Zachary Stray
What is Dash? Dash was created by Plotly, the same creators of Plotly.js. Plotly is a Canada-based company which built Dash and supports its development. Dash was created as a means to make web-based analytic application in a quick and simple way when compared to typical Javascript or stand alone python libraries.
What is Dash? (Continued) Dash helps data scientists build analytical web applications without requiring advanced web development knowledge. Primarily relying on their Python Skills. Three technologies constitute the core of Dash. Flask supplies the web server functionality, React.js renders the user interface of the web page. Plotly.js generates the charts used in your application.
How to think of a dash program You create components To be applied to the layout That interacts by the callback
Flask in Dash Flask is a web application framework written in Python by Armin Ronacher. It allows you to create webpages using Python or to assist in certain parts of it.
React.js in Dash Dash uses React under the hood to render the user interface you see when you load a web page created with Dash. (L5) React is only concerned with the user interface and rendering components
Plotly.js in Dash Plotly plays a huge part in Dash primarily because Dash is designed to fix the weaknesses of Plotly. Plotly can create a wide host of plots and graphs but they all run into the same issue in that they aren t fully dynamic. They aren t capable of updating in real time. You need to re-run the .py script and re-generate the .html file to see any updates. (L7) However this is why Dash was created. Dash takes what plotly has done and then allows it to communicate with other components and update in real time.
How they work together Python code for the layout and logic Flask serves as the webserver React is use to Render the UI Plotly is used to create interactive
Dash Example One: Basics Pandas is a python library that is commonly used alongside Dash. It is one of the most popular data wrangling packages which brings no surprise that it would be used in Dash.
Dash Example Two: Callback @callback behaves similarly to buttons, allowing us to display data and information in a new way. Alert allows you to create contextual feedback messages on user actions.
Dash Example Three: Graphs dcc.Graph allows us to create plotly graphs. It is super easy for us to change graphs. https://plotly.com/python/
Dash Example Four: Adding To A Graph Use Callback to add arguments to update_graph
Conclusion Dash is the upgraded version of plotly that takes everything plotly can do and takes it a step higher by creating a system dedicated to using it. This ease of use is what makes Dash so useful for creating compelling statistics that everyone can see and use easily.
How to download Dash 1. Download the latest version of python if you don t already have it. https://www.python.org/downloads/ 2. Download Dash and Panda using Pip (Pip is part of python) 3. pip install dash pip install Pandas 4. Those are the most important to download but there are many more you can get such as dash-bootstrap-components. 5. Still need help? Use this: https://www.youtube.com/watch?v=vkuL9Be0S7w
Example 1 Code from dash import Dash, html, dash_table import pandas as pd # Incorporate data df = pd.read_csv('https://raw.githubusercontent.com/plotly/datasets/master/gapminder2007.csv') # Initialize the app app = Dash(__name__) # App layout app.layout = html.Div([ html.Div(children='My First App with Data'), dash_table.DataTable(data=df.to_dict('records'), page_size=20) ]) # Run the app if __name__ == '__main__': app.run(debug=True)
Example Code 2 DashFavoriteFood.txt Name, Food Kyle, Lemon Bob, Carrot Keven, Apples Cody, Steak Emily, Milkshake Pablo, Pear Terry, Hamburger Astrid, Gumbo Perry, Salmon Derrick, Chicken from dash import Dash, Input, html, Output, callback, dash_table import pandas as pd import dash_bootstrap_components as dbc # Incorporate data df = pd.read_csv('DashFavoriteFood.txt') # Initialize the app app = Dash(__name__) # App layout app.layout = html.Div([ html.Div(children='Favorite Foods'), dash_table.DataTable(df.to_dict('records'),[{"name": i, "id": i} for i in df.columns], id='tbl'), dbc.Alert(id='tbl_out'), ]) # Button Response @callback(Output('tbl_out', 'children'), Input('tbl', 'active_cell')) def update_graphs(active_cell): return str(active_cell) if active_cell else "Click the table" # Run the app if __name__ == '__main__': app.run(debug=True)
Example Code 3 from dash import Dash, html, dash_table, dcc import pandas as pd import plotly.express as px # Incorporate data df = pd.read_csv('https://raw.githubusercontent.com/plotly/datasets/master/gapminder2007.csv') # Initialize the app app = Dash(__name__) # App layout app.layout = html.Div([ html.Div(children='Average life expetancy'), dash_table.DataTable(df.to_dict('records'),[{"name": i, "id": i} for i in df.columns], id='tbl', page_size=10), html.A(children='https://plotly.com/python/'), #dcc.Graph(figure=px.histogram(df, x='continent', y='lifeExp', histfunc='avg')), dcc.Graph(figure=px.scatter(df, x='continent', y='lifeExp')), ]) # Run the app if __name__ == '__main__': app.run(debug=True)
Example Code 4 DashExample.txt from dash import Dash, html, dcc, callback, Output, Input, State import pandas as pd import plotly.express as px app = Dash(__name__) global df df = pd.read_csv('DashExample.txt') # App layout app.layout = html.Div([ #title html.Div(className='row', children='Age To Sport', style={'textAlign': 'center', 'color': 'blue', 'fontSize': 30}), Name,Age,Sport Zac Stray,21,Wrestling Steve Rogers,38,Mixed Martial Arts Jonh Doe,27,Football Charrels,48,Football Derrick Blade,27,Fencing Evengeline Laura,24,Fencing Willow Basket,34,Wrestling Rahmschnitzel Cream,18,Football Sporticus Legion,44,Mixed Martial Arts #input html.Div(className='row', children=[ html.Div([ dcc.Input(id='name-input', type='text', placeholder='Enter Name'), dcc.Input(id='age-input', type='number', placeholder='Enter Age'), dcc.Input(id='sport-input', type='text', placeholder='Enter Sport'), html.Button(id='submit-button-state', n_clicks=0, children='Submit') ]) ]), #graph html.Div(className='six columns', children=[ dcc.Graph( figure={}, id='graph') ]), ]) # Add controls to build the interaction @callback( Output(component_id='graph', component_property='figure'), Input('submit-button-state', 'n_clicks'), State('name-input', 'value'), State('age-input', 'value'), State('sport-input', 'value') ) def update_graph(n_clicks, name, age, sport): df = pd.read_csv('DashExample.txt') if name and age and sport: nd = pd.DataFrame({ 'Name':[name], 'Age':[age], 'Sport':[sport]} ) df = pd.concat([df, nd], ignore_index=True) return px.scatter(df, x='Sport', y='Age', hover_data='Name') # Run the app if __name__ == '__main__': app.run(debug=True)
Resources (L1)https://realpython.com/lessons/what-is-dash/ (L2)https://realpython.com/python-dash/ (L3)https://community.plotly.com/t/plotly-ecosystem-explanation/53826/2 (L4)https://dash.plotly.com/ (L5)https://medium.com/plotly/introducing-dash-5ecf7191b503 (L6)https://dash.plotly.com/react-for-python-developers (L7)https://dash.plotly.com/tutorial (L8)https://aiplanet.com/learn/data-visualization-plotly-dash/introduction-to-plotly-and- dash/949/introduction-to-plotly-and-dash


")


")


![Prevention and Combating of Hate Crimes and Hate Speech Bill [B.9B.2018]](/thumb/60513/prevention-and-combating-of-hate-crimes-and-hate-speech-bill-b-9b-2018.jpg)