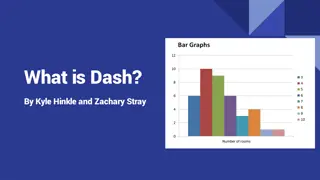
What is Dash?. By Kyle Hinkle and Zachary Stray
Dash, created by Plotly, provides a simple way to build web-based analytical applications without the need for advanced web development knowledge. It leverages Python skills and a combination of Flask, React.js, and Plotly.js to streamline the process of creating interactive data visualizations in r
5 views • 40 slides
Interactive Plotting with ggplot and Shiny: Enhancing Galaxy Visualization Tools
Explore the concept of transforming existing ggplot2 Galaxy tools into interactive platforms using Shiny or Plotly implementations. Discover a variety of plot types available with ggplot2, such as barplots, violin plots, PCA plots, and heatmaps. Utilize additional plot options through various geom_*
1 views • 9 slides

