Understanding Family Caregiving and Population Change
Explore the dynamics of unpaid family caregiving responsibilities between men and women, analyze the impact of population change on care demands, and consider the economic implications of supporting family caregivers. Delve into the gender agenda, economic investments in women's human capital, and methodologies used to assess care supply and demand. Uncover the underlying assumptions and caveats shaping the discourse on family caregiving.

Download Presentation

Please find below an Image/Link to download the presentation.
The content on the website is provided AS IS for your information and personal use only. It may not be sold, licensed, or shared on other websites without obtaining consent from the author. Download presentation by click this link. If you encounter any issues during the download, it is possible that the publisher has removed the file from their server.
E N D
Presentation Transcript
FROM US $30 TO US $20: ON HOW TO SUPPORT FAMILY CAREGIVING AND MAKE IT A LEGITIMATE CHOICE Estela Rivero, Population Council Anairis Hern ndez Jabalera, Brown University Thank you to IDRC, Hewlett and Flora Foundation and UNWomen
Objectives Use time use, paid labor and population projections information to: Understand how unpaid family care responsibilities are distributed between men and women Estimate how much one would have to compensate family caregivers for their time Analyze how population change affects care demands and this compensation, if family/society roles remained unchanged
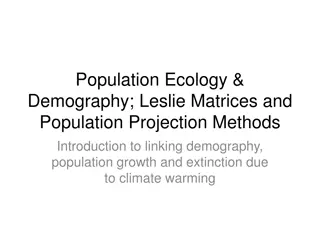
Why do we care: a) Population change & increasing needs in a context of poor social security systems 35 Age structure of the population, Mexico 2010-2050 30 25 20 % 15 < 6 yo <15 yo 10 >60yo 5 0
Why do we care? b) Gender agenda: Tensions between different women s demands, responsibilities and advancements Schooling and paid work (Access to information and $) Leisure Inequality of opportunities Caregiving, Hhld work Lack of recognition, time restriction Recognition
Why do we care? c) Economy-wise: How are the investments in women s human capital recovered over the short and the long run? What changes can we make to promote a better use of these resources, in a way that both men and women (and the different generations) benefit?
Methodology TUD Unpaid care supply and demand by sex and age group in 2011 Hhld income survey Specialist salaries in 2010 Monetary value of care time provided and demanded by sex and age in 2010 Projected care needs and caregivers Monetary value of care time provided and demanded by sex and age from 2011 to 2050 Population projections 2010-2050
Underlying assumptions/ Caveats The demand and offer of care by sex and age within hhlds remains the same We cannot know who is not well cared for, nor who will not well cared for in the future
To consider when estimating a fair contribution Available men and women who are effective caregivers (%) Average care time of effective caregivers 20.0 35 18.0 30 16.0 14.0 25 Weekly hours 12.0 20 10.0 % 15 8.0 6.0 10 4.0 5 2.0 0.0 0 < 6yo < 15yo > 60yo < 6 yo < 15 yo > 60 yo Men Women
To consider when estimating a fair contribution $ value of care provided Potential caregivers (US$ 2010) Additional monetary contribution of effective caregivers (US$ 2010) (E )=(C )- (D) Effective caregivers (%) Time of effective caregivers $ value of care provided Effective caregivers (US$ 2010) (C ) Type of care (A ) (B) (D) Caregiver s sex 12 18 8 23 30 19 16.2 10.7 6.5 17.2 17.8 9.3 5 2 5 1 2 5 1 4 < 6 yo < 15 yo > 60 yo < 6 yo < 15 yo > 60 yo 16 4 11 26 5 10 1 10 30 1 * Per week estimates
Family caregivers weekly compensation 2010 to 2050 35 30 25 men to <6 US $ 2010 20 women to <6 men to <15 15 women to <15 men to >60 10 women to >60 5 - 2010 2012 2014 2016 2018 2020 2022 2024 2026 2028 2030 2032 2034 2036 2038 2040 2042 2044 2046 2048 2050
Total expenditure on family caregivers weekly compensation 2010 to 2050 3,500 =5,000 3,000 =4,750 2,500 men to <6 US 2010 $ (1 M) 2,000 women to <6 men to <15 1,500 women to <15 men to >60 1,000 women to >60 500 - 2022 2010 2012 2014 2016 2018 2020 2024 2026 2028 2030 2032 2034 2036 2038 2040 2042 2044 2046 2048 2050
Final remarks Paying family caregivers would cost 5,000 US$M and this amount will go over time to 4,750 US$M Individual contribution is varies between $30 US and $1 US This is less than the benefits of some cash transfer programs, but can help to decrease the stigma of care work as women s work Can also serve as a transition phase for women from the house to the paid economy To estimate real benefits over the long term, we need to see what happens when estimations are done with opportunity costs
Ideas Ideas Evidence Evidence Impact Impact The Population Council conducts research The Population Council conducts research and delivers solutions that improve lives and delivers solutions that improve lives around the world. Big ideas supported by around the world. Big ideas supported by evidence: It s our model for global change. evidence: It s our model for global change.