Impacts of Tropospheric Ozone and Stratospheric Transport Contribution
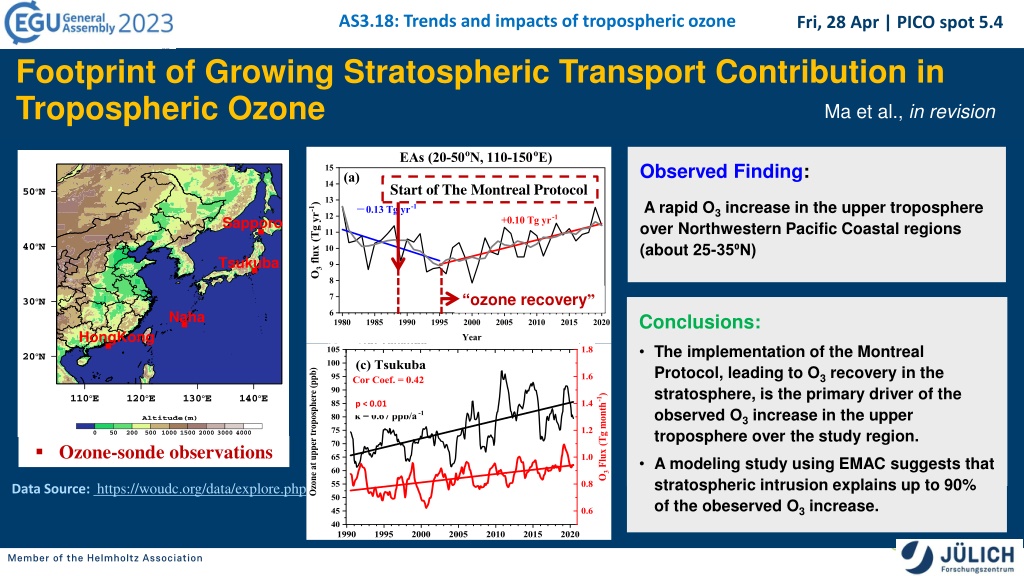
The study examines the trends and impacts of tropospheric ozone, focusing on the significant increase observed over the Northwestern Pacific Coastal regions. It explores the primary drivers behind this ozone increase, attributing up to 90% to stratospheric intrusions as a result of the Montreal Protocol implementation. Ozone-sonde observations and modeling studies support these findings, indicating the crucial role of stratospheric transport in shaping ozone levels in the upper troposphere. The analysis delves into seasonal variations and height distributions to further elucidate the complex dynamics between stratospheric influences and boundary layer processes.

Download Presentation

Please find below an Image/Link to download the presentation.
The content on the website is provided AS IS for your information and personal use only. It may not be sold, licensed, or shared on other websites without obtaining consent from the author. Download presentation by click this link. If you encounter any issues during the download, it is possible that the publisher has removed the file from their server.
E N D
Presentation Transcript
AS3.18: Trends and impacts of tropospheric ozone Fri, 28 Apr | PICO spot 5.4 Footprint of Growing Stratospheric Transport Contribution in Tropospheric Ozone Ma et al., in revision Observed Finding: Spring, Summer Autumn, Winter Start of The Montreal Protocol A rapid O3increase in the upper troposphere over Northwestern Pacific Coastal regions (about 25-35 N) ozone recovery Scientific questions: Conclusions: What is the primary factor driving the observed O3increase: stratospheric intrusion vs. export from the boundary layer (photochemical production)? observed O3increase in the upper troposphere over the study region. The implementation of the Montreal Protocol, leading to O3recovery in the stratosphere, is the primary driver of the p < 0.01 What is the percentage contribution of stratospheric intrusions to the O3increase? A modeling study using EMAC suggests that stratospheric intrusion explains up to 90% of the obeserved O3increase. Ozone-sonde observations Data Source: https://woudc.org/data/explore.php *p < 0.01
AS3.18 | PICO spot 5.4 Footprints of Growing Stratospheric Transport Contribution in Tropospheric Ozone APR 28 2023 I XIAODAN MA Jianping Huang, Michaela I. Hegglin, Michael Sprenger, Patrick J ckel, and Tianliang Zhao THANK YOU!
AS3.18: Trends and impacts of tropospheric ozone Fri, 28 Apr | PICO spot 5.4 Footprint of Growing Stratospheric Transport Contribution in Tropospheric Ozone Ma et al., in revision Observed Finding: A rapid O3increase in the upper troposphere over Northwestern Pacific Coastal regions (about 25-35 N) Scientific questions: What is the primary factor driving the observed O3increase: stratospheric intrusion vs. export from the boundary layer (photochemical production)? What is the percentage contribution of stratospheric intrusions to the O3increase? Ozone-sonde observations Data Source: https://woudc.org/data/explore.php *p < 0.01 SS: spring, summer (3-8) AW: autumn. Winter (9-12-2)
AS3.18 | PICO spot 5.4 P2: 2009-2017 P1: 2000-2008 18 120 18 120 (e) (a) Hong Kong (22oN) 16 16 Conclusions: 100 100 14 14 12 80 12 80 Start of The Montreal Protocol Height (km) Height (km) The implementation of the Montreal Protocol, leading to O3recovery in the stratosphere, is the primary driver of the observed O3increase in the upper troposhere over the study regions. 10 10 60 60 8 8 40 40 6 6 4 4 20 20 2 2 0 18 0 0 0 (ppb) J F M A M J J A S O N D (ppb) J F M A M J J A S O N D 120 18 120 (f) (b) 16 16 100 100 Naha (26oN) 14 14 A modeling study using EMAC suggests that stratospheric intrusion explains up to 90% of the O3increase. 12 80 12 80 Height (km) Height (km) 10 ozone recovery 10 60 60 8 8 40 6 40 6 4 4 20 20 2 2 0 0 0 18 0 120 (ppb) J F M A M J J A S O N D (ppb) J F M A M J J A Tsukuba (36oN) S O N D 18 120 (c) (g) 20 18 16 16 (k) EMAC O3s: P2-P1 100 100 14 14 16 15 12 80 Height (km) 12 80 Height (km) 10 10 14 60 60 p < 0.01 10 8 8 40 6 40 6 12 5 4 4 Height (km) 20 20 2 2 10 0 18 0 120 0 0 0 (ppb) J F M A M J J A S O N D (ppb) J F M A M J J A S O N D 18 120 (d) (h) 8 16 16 Sapporo (43oN) -5 100 100 14 14 6 12 12 80 80 Height (km) Height (km) 40 -10 10 10 4 60 60 8 8 -15 2 40 6 6 4 4 20 20 0 -20 2 2 J F M A M J J A S O N D 0 0 (ppb) 0 0 (ppb) (ppb) J Month-height distribution of ozone F M A M J J A S O N D J F M A M J J A S O N D
AS3.18 | PICO spot 5.4 Observation data quality control Calculation of STE O3flux: Positive: downward transport : the 380K cross-isentrope ozone mass flux, calculated by the diabatic heating rate (?) and the isentropic density (?). ?3 ?380? ??3 ?? Data used: MERRA2 reanalysis Reference: (Liao et al., 2020, https://doi.org/10.1029/2020JD033054 )
AS3.18 | PICO spot 5.4 Model performance vs Observations Ozone in Tsukuba (c) 16 100 Brief introduction of climate model EMAC 18 120 120 18 (c) Full name: The European Centre for Medium-Range Weather Forecasts Hamburg (ECHAM)/Modular Earth Submodel System (MESSy) Atmospheric Chemistry (EMAC) model 16 100 14 14 12 80 12 80 Period 1 (2000-2008) Height (km) Height (km) 10 10 60 60 8 8 40 6 40 6 4 4 20 20 2 2 Capability: the chemistry and dynamics of the stratosphere and troposphere are being studied and modelled as a single entity. 0 0 0 0 J F M A M J J A S O N D (ppb) J F M A M J J A S O N D (ppb) 120 18 18 120 (g) (g) 16 16 100 100 14 14 12 80 12 80 Period 2 (2009-2017) Height (km) Height (km) 10 10 60 60 8 Time period: Hindcast simulations with specified dynamics (1979 2019), i.e. nudged towards ERA-Interim reanalysis data. The time step length was 720 s. 8 6 40 40 6 4 4 20 20 2 2 0 0 0 0 J F M A M J J A S O N D (ppb) (ppb) J F M A M J J A S O N D 18 40 40 18 (k) (k) 16 16 30 30 Spatial resolution: T42 (triangular) spectral resolution; corresponding to a quadratic Gaussian grid of 2.8 2.8 in latitude and longitude); Vertical: 90 (L90MA) model levels from 1000hPa to 0.01hPa 14 14 20 20 12 12 10 10 Height (km) Height (km) Period 2-Period 1 10 10 0 0 8 8 -10 -10 6 6 -20 -20 4 4 -30 -30 2 2 0 -40 0 -40 J F M A M J J A S O N D (ppb) J F M A M J J A S O N D (ppb) Reference: J ckel et al., 2016, https://doi.org/10.5194/gmd-9-1153-2016