Surface Ozone Seasonal Cycle Reversal Study in Northeastern United States Lower Manhattan
Study on the reversal of the surface ozone seasonal cycle over Northeastern United States Lower Manhattan, analyzing the impact of NOx and VOC emissions on Surface O3 levels. Research shows a 26% decrease in regional NOx emissions leading to changes in the seasonal cycle of surface ozone concentrations. The study provides insights into the complex nonlinear chemistry controlling surface O3 levels and the role of precursor emissions and meteorological conditions in influencing ozone levels.
Download Presentation

Please find below an Image/Link to download the presentation.
The content on the website is provided AS IS for your information and personal use only. It may not be sold, licensed, or shared on other websites without obtaining consent from the author.If you encounter any issues during the download, it is possible that the publisher has removed the file from their server.
You are allowed to download the files provided on this website for personal or commercial use, subject to the condition that they are used lawfully. All files are the property of their respective owners.
The content on the website is provided AS IS for your information and personal use only. It may not be sold, licensed, or shared on other websites without obtaining consent from the author.
E N D
Presentation Transcript
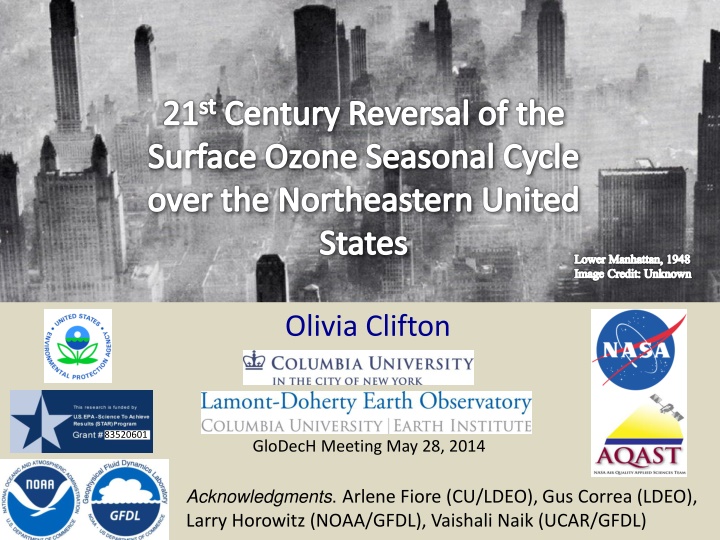
21stCentury Reversal of the Surface Ozone Seasonal Cycle over the Northeastern United States Lower Manhattan, 1948 Image Credit: Unknown Olivia Clifton 83520601 GloDecH Meeting May 28, 2014 Acknowledgments. Arlene Fiore (CU/LDEO), Gus Correa (LDEO), Larry Horowitz (NOAA/GFDL), Vaishali Naik (UCAR/GFDL)
Surface Ozone (O3): degrades air quality & is injurious to human health and vegetation Non-methane volatile organic compounds (NMVOCs) Carbon Monoxide (CO) Surface O3 = NOx + sunlight + Methane (CH4)
Surface O3 levels controlled by nonlinear chemistry OZONE CONCENTRATIONS vs. NOx & VOC EMISSIONS Ridge NOx-limited NOx-saturated Reductions in NOx emissions achieve local-to-regional decreases in surface O3 and reductions in CH4 emissions lower the surface O3 everywhere [Fiore et al., 2002] In highly polluted regions (very high regional NOx), NOx can destroy surface O3
Seasonal cycle of observational surface O3 at NE monitoring sites during 1991-1996 mean across 3 regionally representative Clean Air Status and Trends Network (CASTNet) sites [Reidmiller et al., 2008] Regionally representative site (each site has 4-6 years of observations) Washington Crossing, NJ Penn State, PA Connecticut Hill, NY Feb Apr Jun Aug Oct Dec
Seasonal cycle of observational surface O3 at NE monitoring sites during 1991-1996 Densely populated and highly polluted region mean across 3 regionally representative Clean Air Status and Trends Network (CASTNet) sites [Reidmiller et al., 2008] Regionally representative site Feb Apr Jun Aug Oct Dec Highest surface O3 during the summer due to presence of precursor emissions (both NOx and VOCs) and favorable meteorological conditions (i.e. high temperatures, low cloud cover, and stagnation)
Change in seasonal cycle of observational surface O3 over NE due to a 26% decrease in regional NOx emissions mean across 3 regionally representative Clean Air Status and Trends Network (CASTNet) sites [Reidmiller et al., 2008] -26% NE NOx Regionally representative site Solid: 1991-1996, pre-NOx emission controls Dashed: 2004-2009, post-NOx emission decreases Feb Apr Jun Aug Oct Dec
Change in seasonal cycle of observational surface O3 over NE due to a 26% decrease in regional NOx emissions mean across 3 regionally representative Clean Air Status and Trends Network (CASTNet) sites [Reidmiller et al., 2008] -26% NE NOx Regionally representative site How will the surface O3 seasonal cycle over the NE US respond to further regional as well as global precursor emission changes during the rest of 21st C? Solid: 1991-1996, pre-NOx emission controls Dashed: 2004-2009, post-NOx emission decreases Feb Apr Jun Aug Oct Dec
GFDL CM3 chemistry-climate model is the tool that we use to project 21st C surface O3 Modular Ocean Model version 4 (MOM4) & Sea Ice Model GFDL-CM3 GFDL-CM3 cubed sphere grid ~2 x2 48 vertical levels Forcing Solar Radiation Well-mixed Greenhouse Gas Concentrations Volcanic Emissions Atmospheric Dynamics & Physics Radiation, Convection (includes wet deposition of tropospheric species), Clouds, Vertical diffusion, and Gravity wave Atmospheric Chemistry 86km Ozone Depleting Substances (ODS) Chemistry of Ox, HOy, NOy, Cly, Bry, and Polar Clouds in the Stratosphere Chemistry of gaseous species (O3, CO, NOx, hydrocarbons) and aerosols (sulfate, carbonaceous, mineral dust, sea salt, secondary organic) Pollutant Emissions (anthropogenic, ships, biomass burning, natural, & aircraft) Aerosol-Cloud Interactions Dry Deposition Donner et al. [2011]; Golaz et al. [2011]; Levy et al. [2013]; Naik et al. [2013]; Austin et al. [2013]; John et al. [2012] Land Model version 3 (soil physics, canopy physics, vegetation dynamics, disturbance and land use) c/o V. Naik
Evaluation of CM3 with observational surface O3 over NE mean across 3 regionally representative CASTNet sites -10% IMW NOx [Reidmiller et al., 2008] -26% NE NOx Regionally representative site OBS CM3 Solid: 1991-1996, pre-NOx emission controls Dashed: 2004-2009, post-NOx emission decreases 3 Ensemble member mean Feb Apr Jun Aug Oct Dec
Evaluation of CM3 with observational surface O3 over NE mean across 3 regionally representative CASTNet sites -10% IMW NOx [Reidmiller et al., 2008] -26% NE NOx Regionally representative site OBS CM3 Solid: 1991-1996, pre-NOx emission controls Dashed: 2004-2009, post-NOx emission decreases Despite high bias, CM3 captures the overall structure of the seasonal surface O3 changes over the NE & thus the response of surface O3 to the NOx emission controls 3 Ensemble member mean Feb Apr Jun Aug Oct Dec
Evaluation of CM3 with observational surface O3 over NE mean across 3 regionally representative CASTNet sites -10% IMW NOx [Reidmiller et al., 2008] -26% NE NOx Regionally representative site OBS CM3 Solid: 1991-1996, pre-NOx emission controls Dashed: 2004-2009, post-NOx emission decreases Despite high bias, CM3 captures the overall structure of the seasonal surface O3 changes over the NE & thus the response of surface O3 to the NOx emission controls 3 Ensemble member mean Feb Apr Jun Aug Oct Dec We conclude that we can use CM3 to determine how surface O3 will respond to future precursor emission changes
Month of peak monthly mean surface O3(3 ensemble member mean) 2006-2015 Feb Apr Jun Aug Oct Dec
Month of peak monthly mean surface O3(3 ensemble member mean) 2006-2015 2091-2100 Feb Apr Jun Aug Oct Dec Clear shift in the peak from summer to winter/early spring over Eastern US
Month of peak monthly mean surface O3 (3 ensemble member mean) 2006-2015 2091-2100 Under RCP8.5 RCPs created in conjunction with IPCC AR5 and CMIP5 Designed to attain a specific RF (8.5 W/m2) by 2100 The most extreme 21st C Climate scenario with doubling of global CH4 abundance by 2100 Feb Apr Jun Aug Oct Dec Clear shift in the peak from summer to winter/early spring over Eastern US
Month of peak monthly mean surface O3 (3 ensemble member mean) 2006-2015 2091-2100 Under RCP8.5 RCPs developed by CMIP effort in support of IPCC Designed to attain a specific RF (8.5 W/m2) by 2100 The most extreme 21st C Climate scenario with doubling of global CH4 abundance by 2100 Feb Apr Jun Aug Oct Dec Clear shift in the peak from summer to winter/early spring over Eastern US Investigate the drivers of this shift over NE (drastic regional NOx emission decreases, changes in global CH4 abundance, increased climate warming, or some combination?) by examining the change in seasonal cycle at beginning & end of 21st C Evaluate the magnitude of the change in surface O3 & the change in shape of seasonal cycle Compare RCP8.5 with RCP4.5 (moderate; 10% decrease of global CH4) as well as with sensitivity simulations
Surface O3 seasonal cycle at beginning and end of the 21st C under RCP4.5 and RCP8.5 -10% global CH4 +114% global CH4 -90% NE NOx -90% NE NOx Each symbol is ensemble member; lines are ensemble member mean (3) Feb Apr Jun Aug Oct Dec
Surface O3 seasonal cycle at beginning and end of the 21st C under RCP4.5 and RCP8.5 -10% global CH4 +114% global CH4 -90% NE NOx -90% NE NOx Feb Apr Jun Aug Oct Dec NE resembles baseline O3 conditions by end of 21st C [NRC, 2009; Parrish et al., 2013] Reversal of the NE surface O3 seasonal cycle during 21st C after 2020s (not shown)
Surface O3 seasonal cycle at beginning and end of the 21st C under RCP8.5 and a sensitivity simulation holding all CH4 at 2005 levels -90% NE NOx +114% global CH4 -90% NE NOx +0% global CH4 Feb Apr Jun Aug Oct Dec Feb Apr Jun Aug Oct Dec The doubling of global methane abundance raises the entire seasonal cycle by about 6-11 ppb, with the greatest differences between RCP8.5 and RCP8.5_2005CH4 during January through March when the O3 lifetime is longest
Surface O3 seasonal cycle at beginning and end of the 21st C under RCP8.5 and a sensitivity simulation holding all CH4 at 2005 levels -90% NE NOx +114% global CH4 -90% NE NOx +0% global CH4 Feb Apr Jun Aug Oct Dec Reduced NOx emissions play a role in increasing surface O3 during the winter in highly polluted regions [US EPA, 2014] While NOx exerts a dominant influence on the shape of the surface O3 seasonal cycle, global CH4 abundance influences the baseline surface O3 abundance during all months
Rising baseline surface O3 by 2100 from increases in global CH4 abundance NE US 36-46 N 80-70W IMW US 36-46N 115-105W - 43% IMW NOx - 90% NE NOx Feb Apr Jun Aug Oct Dec RCP8.5_2005CH4_rad 2091-2100 same as RCP8.5 2091-2100 (not shown) RCP8.5_2005CH4_chem (dashed) 2091-2100 same as RCP8.5_2005CH4 2091-2100 The CH4 impact on surface O3 in the model occurs mainly though atmospheric chemistry, rather than through the additional climate forcing from CH4
Impact of a warming climate on the surface O3 seasonal cycle JJA NE temp inc. by 2.5 C RCP4.5_WMGG & RCP8.5_WMGG isolate impacts from a changing climate Same findings under RCP4.5_WMGG & RCP8.5_WMGG, but magnitude of each change depends on the regional temperature increases JJA NE temp inc. by 5.5 C Feb Apr Jun Aug Oct Dec
Impact of a warming climate on the surface O3 seasonal cycle JJA NE temp inc. by 2.5 C RCP4.5_WMGG & RCP8.5_WMGG isolate impacts from a changing climate JJA NE temp inc. by 5.5 C General increases in summertime surface O3 over NE reflect Climate change penalty Wu et al., 2008 need for stricter emission controls to achieve a given level of air quality due to warming climate (but in absence of precursor emission changes) Feb Apr Jun Aug Oct Dec
Impact of a warming climate on the surface O3 seasonal cycle JJA NE temp inc. by 2.5 C RCP4.5_WMGG & RCP8.5_WMGG isolate impacts from a changing climate Broadening of the summertime peak over the NE with similar levels of surface O3 in June- August, as opposed to a clear peak in July JJA NE temp inc. by 5.5 C Feb Apr Jun Aug Oct Dec Climate change penalty predominantly affects surface O3 during the photochemically active season, May-September, in regions with sufficiently high anthropogenic NOx emissions
Conclusions Reversal of NE US high-surface O3 season Changing regional emissions alters high surface O3 season Climate change broadens surface O3 peak in NE US Rising global CH4 can offset O3 decreases from U.S. precursor reductions NE at end of 21st C more representative of baseline O3 conditions Questions?
