Trends in Precision Soil Testing and Soil Nitrate Levels in Agriculture
Explore the trends in precision soil testing, zone/grid samples compared to total samples, nitrate levels following wheat and canola crops, and soil nitrate variability between fields in Canada. The data spans from 1986 to 2015, showcasing shifts in agricultural practices and soil health indicators over time.

Download Presentation

Please find below an Image/Link to download the presentation.
The content on the website is provided AS IS for your information and personal use only. It may not be sold, licensed, or shared on other websites without obtaining consent from the author. Download presentation by click this link. If you encounter any issues during the download, it is possible that the publisher has removed the file from their server.
E N D
Presentation Transcript
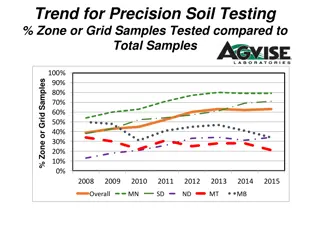
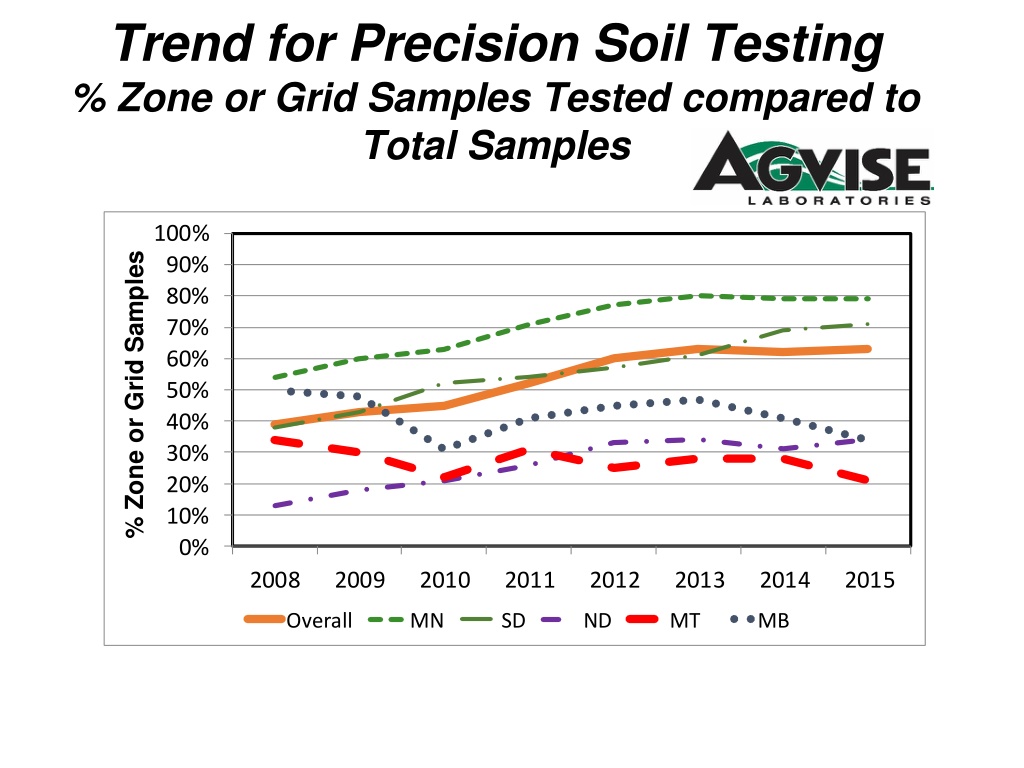
Trend for Precision Soil Testing % Zone or Grid Samples Tested compared to Total Samples 100% % Zone or Grid Samples 90% 80% 70% 60% 50% 40% 30% 20% 10% 0% 2008 2009 2010 2011 2012 2013 2014 2015 Overall MN SD ND MT MB
%Zone or Grid Samples Tested Compared to Conventional Whole Field Composite Samples in 2015 100% 90% 79% 80% 71% 70% 63% 60% 50% 40% 34% 34% 30% 21% 20% 10% 0% MN ND SD MT MB Overall
AGVISE Laboratories %Zone or Grid Samples Northwood laboratory 1997 - 2015 70% 60% % Grid or Zone Samples Tested Compared To Conventional Whole Field Composite Samples Tested 50% 39%40%39%41% 40% 26%28%31%33% 30% 22% 18% 20% 15%16% 14%15% 15% 11% 11% 11% 8% 10% 0% 1997 1998 1999 2000 2001 2002 2003 2004 2005 2006 2007 2008 2009 2010 2011 2012 2013 2014 2015
Average Soil Nitrate following Wheat in 2015 MB Fall 2015 Samples 52 (lb/a 0-24 samples) 42 49 52 24 49 46 43 38 37 36 43 43 ND 35 34 36 38 33 29 47 MN 41 48 SD 41 55
Average Soil Nitrate Following Wheat in Canada 1986 - 2015 120 107 96 100 81 Nitrate-N (0-24 lb/a) 80 68 6459 50464749585650 4952 504239 50 60 47 4238 4139343440 4035 35 40 20 0 8687888990919293949596979899 0 1 2 3 4 5 6 7 8 9 101112131415
Soil Nitrate Variability Between Fields Following Wheat in Canada 2015 >100 6% Total Nitrate 0-24" lb/a Nitrate Category 81-100 6% 11% 61-80 41-60 22% 21-40 39% 0-20 16% 0% 10% 20% 30% 40% 50% % of Fields Testing in Each Category
Average Soil Nitrate following Canola in 2015 MB Fall 2015 Samples 37 (lb/a 0-24 samples) 45 45 49 29 49 49 49 38 29 41 ND 29 28 MN SD
Average Soil Nitrate Following Canola 1986 - 2015 90 7582 80 70 60 6057 58 535751 54 Nitrate-N (0-24 lb/a) 60 4349 46 4445 44 50 40 353640 3935 323229343736 40 30 20 10 0 88 89 90 91 92 93 94 95 96 97 98 99 0 1 2 3 4 5 6 7 8 9 10 11 12 13 14 15
Soil Nitrate Variability Between Fields Following Canola in Canada 2015 >100 6% Total Nitrate 0-24" lb/a Nitrate Category 81-100 5% 10% 61-80 41-60 22% 21-40 38% 0-20 19% 0% 10% 20% 30% 40% % of Fields Testing in Each Category
Average Soil Nitrate Following Barley in Canada 1986 - 2015 110 100 90 81 Nitrate-N (0-24 lb/a) 80 70 66 64 605864 70 58 5458 5550 43394550534749 60 4946 454245 44 50 3737 363635 40 30 20 10 0 8687888990919293949596979899 0 1 2 3 4 5 6 7 8 9 101112131415
Soil Nitrate Variability Between Fields Following Barley in Canada - 2015 >100 6% Total Nitrate 0-24" lb/a Nitrate Category 81-100 7% 10% 61-80 41-60 20% 21-40 36% 0-20 21% 0% 10% 20% 30% 40% % of Fields Testing in Each Category
Average Soil Nitrate Following Flax in Canada 1988 - 2013 110 100 8789 90 Nitrate-N (0-24 lb/a) 80 64 70 6058 56 55 60 484751 45 50 42 42 40 293439 38 383437 38 40 32 31 28 24 30 20 10 0 88 89 90 91 92 93 94 95 96 97 98 99 0 1 2 3 4 5 6 7 8 9 10 11 12 13 14
Soil Nitrate Variability Between Fields Following Potato in Canada - 2015 >100 8% Total Nitrate 0-24" lb/a Nitrate Category 81-100 12% 16% 61-80 41-60 31% 21-40 26% 0-20 7% 0% 10% 20% 30% 40% 50% 60% % of Fields Testing in Each Category
Average Soil Nitrate Following Potato in Canada 1986 - 2015 106 110 96 93 100 92 90 81 81 79 707374 Nitrate-N (0-24 lb/a) 80 72 6872 69 67 6357 70 62 61 5055 5451 54 60 50 46 50 34 34 40 30 20 10 0 88 89 90 91 92 93 94 95 96 97 98 99 0 1 2 3 4 5 6 7 8 9 10 11 12 13 14 15
Average Soil Nitrate following Corn in 2015 Fall 2015 samples MB (lb/a 0-24 samples) 50 74 69 52 68 51 49 ND 49 57 35 37 60 68 84 63 MN 68 SD 81 33 78
Average Soil Nitrate Following Corn in Canada 1988 - 2015 106 110 96 859093 100 8485 90 80 77 73 80 71 Nitrate-N (0-24 lb/a) 655963 6564 64 70 5860 5659 5455 54 54 60 4542 50 40 30 20 10 0 88 89 90 91 92 93 94 95 96 97 98 99 0 1 2 3 4 5 6 7 8 9 10 11 12 13 14 15
Soil Nitrate Variability Between Fields Following Corn in Canada - 2015 >100 20% Total Nitrate 0-24" lb/a Nitrate Category 81-100 13% 16% 61-80 41-60 19% 21-40 23% 0-20 9% 0% 10% 20% 30% 40% % of Fields Testing in Each Category
Average Soil Nitrate following Soybean in 2015 Fall 2015 samples MB 28 (lb/a 0-24 samples) 27 31 30 33 22 31 36 43 33 27 29 24 33 ND 28 27 27 22 24 28 MN 29 31 SD 44 30 24 39
Average Soil Nitrate Following Soybean in Canada 2008 - 2015 60 50 Nitrate-N (0-24 lb/a) 40 35 32 32 31 30 29 26 30 25 20 10 0 8 9 10 11 12 13 14 15
Soil Nitrate Variability Between Fields Following Soybean in Canada 2015 >100 2% Total Nitrate 0-24" lb/a Nitrate Category 81-100 2% 5% 61-80 41-60 17% 21-40 51% 0-20 23% 0% 10% 20% 30% 40% 50% 60% % of Fields Testing in Each Category
% Soil Samples with Phosphorus less than 10 ppm Fall 2015 samples (0-6 samples) (Olsen P test) MB 41% 47% 48% 64% 16% 68% 43% 32% 24% 77%74% 71% 53% 58% 69% ND 47% 56% 54% 50% 66% 37% 71% MN 40% 52% 36% SD 32% 38% 49% 33% 37%
% Soil Samples with Potassium less than 150 ppm MB Fall 2015 samples (0-6 samples) 37% 13% 30% 30% 31% 6% 19% 15% 27% 4% 5% 2% 16% 76% 36% ND 8% 19% 71% 7% 45% 6% 45% 2% 6% 28% MN 34% SD 36% 1% 5% 33% 39%
% Soil Samples with Zinc less than 1.0 ppm MB Fall 2015 samples (0-6 samples) 49% 61% 51% 59% 28% 76% 52% 31% 36% 75% 90% 81% 49% 66% 40% ND 50% 69% 29% 78% 47 58% 24% 77% 44% MN 53% 26% SD 34% 60% 43% 34% 24%
% Soil Samples with Sulfur less than 15 lb/a MB Fall 2015 samples (0-6 samples) 6% 24% 14% 21% 7% 22% 19%20% 56%25% 18% 13% 35% 23% ND 39% 66% 19% 47% 32% 58% 67% 46% MN 75% 35% 58% SD 84%74% 71% 38% 60%
% Soil Samples with %OM less than 3.0% MB Fall 2015 Samples (0-6 samples) 7% 10% 22% 22% 31% 19% 31% 24% 20% 67%44% 34% 22% 21% 33% ND 35% 60% 77% 25% 29% 34% 30% 52% MN 27% 11% 11% SD 23% 30% 5% 28% 7%
% Soil Samples with Chloride less than 40 lb/a MB Fall 2015 Samples (0-24 samples) 38% 66% 56% 56% 22% 54% 47% 39% 54% 87%70% 53% 41% 44% 62% ND 67% 89% 59% 51% 88% 90% 90% 54% MN 63% 78% SD 55% 83% 72%
% Soil Samples with Copper less than 0.5 ppm MB Fall 2015 samples (0-6 samples) 18% 4% 30% 9% 33% 15% 14% 16% 26% 4% 14% 3% 14% 38% 43% ND 13% 51% 10% 27% 18% 13% 27% 16% 7% MN 6% 9% SD 6% 3% 6% 1%
% Soil Samples with Boron less than 0.4 ppm MB Fall 2015 samples (0-6 samples) 1% 1% 3% 7% 8% 1% 10% 13% 3% 4% 7% 15% 9% 23% 9% ND 7% 22% 38% 78% 6% 26% 44% 27% 16% 7% MN 11% SD 7% 21%35% 18% 14%
% Soil Samples with Soil pH greater than 7.3 MB Fall 2015 samples (0-6 samples) 69% 89% 74% 77% 92% 77% 59% 73% 75 66%50% 74% 78% 63% 96% ND 37% 6% 66% 45% 78% 30% 44% 11% 25% MN 41% 58% SD 27% 28% 19% 25% 22%
% Soil Samples with Soil pH less than 6.0 MB Fall 2015 samples (0-6 samples) 2% 0% 5% 4% 0% 1% 17% 4% 2% 3% 1% 6% 3% 7% 1% ND 1% 52% 3% 15% 5% 13% 16% 25% 27% 17% MN 11% 18% SD 29% 36% 21% 13% 39%
% Subsoil Samples with pH less than 7.0 MB Fall 2015 samples (0-6 samples) 2% 0% 5% 3% 0% 1% 15% 2% 3% 1% 1% 1% 2% 1% 0% ND 3% 52% 2% 6% 1% 7% 9% 25% 17% 9% MN 3% 3% SD 29% 23% 10% 6% 19%
% Soil Samples with Carbonate greater than 5.0% MB Fall 2015 samples (0-6 samples) 40% 58% 22% 22% 21% 5% 16% 31% 9% 11 13% 6% 29% 23% 5% ND 5% 4% 11% 28% 6% 3% 0% 1% MN 12% 23% SD 4% 9% 2% 1%
% Soil Samples with Salts greater than 1.0 MB Fall 2015 Samples (0-6 samples) 13% 11% 9% 5% 18% 12% 8% 14% 18% 3% 19% 8% 35% 15% 9% ND 10% 3% 2% 24% 13% 3% 2% 18% MN 9% 4% SD 1% 1% 3% 11% 3%
Manitoba - % Samples Testing with Salts greater than 1.0 40% 35% 582 NE ND 30% 25% R0G 20% 15% 10% 5% R0K 0% 1998 1999 2000 2001 2002 2003 2004 2005 2006 2007 2008 2009 2010 2011 2012 2013 2014 2015 1:1 salt method expressed as mmhos/cm