Surveillance Data Collection and Analysis for Notifiable Diseases
Conducting surveillance on notifiable diseases requires access to reliable data sources. For conditions like listeriosis and spinal cord injuries, hospitals, laboratories, and trauma centers provide essential data for monitoring and reporting. Lung cancer among nonsmokers may require data from cancer registries and health surveillance systems. Understanding the causes of fluctuations in reported cases, such as increases in tuberculosis, is crucial for effective public health response.

Download Presentation

Please find below an Image/Link to download the presentation.
The content on the website is provided AS IS for your information and personal use only. It may not be sold, licensed, or shared on other websites without obtaining consent from the author. Download presentation by click this link. If you encounter any issues during the download, it is possible that the publisher has removed the file from their server.
E N D
Presentation Transcript
Tutorial 7: Notification/ Reporting Surveillance Was Done by Renad Alhaqbani Color Index Important Textbook Golden notes Extra Main text Males slides Females slides Doctor notes Editing File
Question 1: Assume you work in a region in which none of the following conditions is on the list of notifiable diseases. For each condition: List at least one existing source of data that you need for conducting surveillance on the condition. What factors make the selected source or data system more appropriate than another? A serious infection can result from eating food contaminated with the bacterium Listeria monocytogenes. The disease affects primarily pregnant women, newborns, and adults with weakened immune systems. A person with listeriosis has fever, muscle aches, and sometimes gastrointestinal symptoms (e.g., nausea or diarrhea). If infection spreads to the nervous system, such symptoms as headache, stiff neck, confusion, loss of balance, or convulsions can occur. Infected pregnant women might experience only a mild influenza-like illness; however, infections during pregnancy can lead to miscarriage or stillbirth, premature delivery, or infection of the newborn. In the United States, approximately 800 cases of listeriosis are reported each year. Of those with serious illness, 15% die; newborns and immunocompromised persons are at greatest risk for serious illness and death. Source of Data 1: Data from hospitals records (admission or discharge) Data from the laboratories Add it to notifiable disease to become a passive surveillance The source of data should be based on morbidity more than mortality due to the low case fatality rate. Approximately 11,000 persons sustain a spinal cord injury (SCI) each year in the United States, and 200,000 persons in the United States live with a disability related to an SCI. More than half of the persons who sustain SCIs are aged 15 29 years. The leading cause of SCI varies by age. Motor vehicle crashes are the leading cause of SCIs among persons aged <65 years. Among persons aged 65 years, falls cause the majority of spinal cord injuries. Sports and recreation activities cause an estimated 18% of spinal cord injuries. Source of Data: Data from hospital record (admission or discharge) Data from death certificate due to the high mortality rate Data from trauma center if it's available Data from the emergency medical center Data from rehabilitation center (if we want only the survivors of the SCI, it's NOT complete data) The source of data should be based on the mortality rate. It's serious condition almost all patients will be hospitalized 1) We can't take it from the registry because there's no registry for infectious disease. Usually it's for chronic disease.
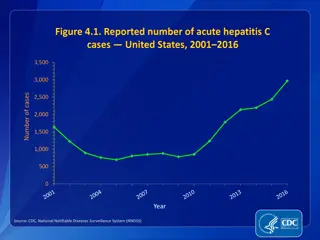
Lung cancer among nonsmokers 3 A usually fatal cancer of the lung can occur in a person who has never smoked. An estimated 10% 15% of lung cancer cases occur among nonsmokers, and this type of cancer appears to be more common among women and persons of East Asian ancestry. Source of Data: Data from cancer registry (smoking information not shown) Data from health surveillance (smoking information shown) The best source of data for a type of cancer is the registry. Question 2: During the previous 6 years, 10 to 15 cases per year of tuberculosis had been reported to a region health department. During the past 3 months, 25 cases have been reported. All but 4 of these cases have been reported from one sector. Describe the possible causes of the increase in reported cases. 1) 2) True increase incidence due to TB exposure False increase incidence because of many reasons: - improve the diagnostic methods - Enhance reporting processes - Change of surveillance system - Increase population size or increase immigrants - Change case definition - Increase awareness of physician of TB tests - Increase awareness of the population to seek medical attention - Untrained staff for testing TB
Question 3: By 1993, E. coli O157:H7 (O157) has been recognized as an important foodborne pathogen that can cause serious illness. Numerous outbreaks across the country have been attributed to ground beef, roast beef, water, apple cider, and unpasteurized milk. Human infection occurs primarily through ingestion of food or water contaminated with bovine fecal material, but person to person transmission also occurs. The organism can survive for extended periods in water, meat stored at subfreezing temperatures, soil, and acidic environments, but can be destroyed by thorough cooking or pasteurization. Patients infected with O157 typically present with severe abdominal cramps, bloody diarrhea, and low grade fever. Children and the elderly are at greatest risk for complications such as hemorrhagic colitis, hemolytic uremic syndrome, and death. In 1990, Region A added E. coli O157:H7 to its reportable disease list. The region requires reporting by health care providers, health care facilities, and laboratories. The Laboratories must also send isolates to the central Laboratory. You are an epidemiologist assigned to the region A Health Division, and are responsible for reviewing surveillance data on a regular basis. What basic descriptive epidemiology would you like to see to characterize the occurrence of E. coli O157:H7 in the region? 1) patient identifying information (name, address, phone no) 2) Demographic information (age, gender, race if need it ) 3) Clinical information (lab results, sign and symptoms, date of infection, hospitalized or not) 4) Risk factors related to infection (occupation, travel, last meal, immune status, environmental factors ex: smoking)
Question 3.2: Following are several tables of E. coli O157:H7 August 1990 through December 1992. Graph the data in Table A in two different formats (e.g., line graph, bar graph, or pie chart) On the basis of the data graphed, what are two interpretations you can make? Was one type of graph easier to interpret? Why or why not? Month 1990 1991 1992 Total January - 2 1 3 February - 2 2 4 March - 2 7 9 Best data graphs: 1) Bar graph 2) Line graph 3) Pie chart April - 5 5 10 May - 1 12 13 June - 10 25 35 Interpretation from data graphs: The 2nd half of the year has higher cases than the 1st half. The cases increase more in the summer. The cases increase year after year. July 2 26 41 69 August 14 28 17 59 September 19 15 19 53 October 12 13 7 32 The graphs are only for representation and for you it understand the idea. We tried our best but we can t guarantee the accuracy November 5 6 9 20 December 7 1 11 19 Total 59 111 156 326 Pie chart Line graph Bar graph the best
Question 3.3: As a class, chart the previous information on E. coli O157:H7 outbreaks on a map. Month 1990 1991 1992 Total This question was skipped by both Dr.Shatha and Dr. Abdullah but the idea is to plot the number of total of cases on the map Baker 0 1 0 1 Benton 1 4 11 16 Clackamas 7 11 21 39 Columbia 1 2 5 8 Coos 0 0 1 1 Deschutes 2 0 0 2 Douglas 2 4 4 10 Grants 0 0 2 2 Jackson 1 0 4 5 Jefferson 0 0 2 2 Josephine 0 0 1 1 Lane 6 9 16 31 Lincoln 2 1 1 4 Linn 4 4 5 13 Malheur 3 0 1 4 Marion 9 8 10 27 Multnomah 11 36 41 88 Polk 1 1 3 5 Umatilla 1 0 3 4 Wasco 0 2 1 3 Washingto n 7 26 19 52 Yamhill 1 2 5 8 Total 59 111 156 326
Question 3.4: On the basis of this new population data, why do you think Multnomah County has the highest number of reported cases of E. coli O157:H7 infections? They have a large population. Also, rural areas have a higher risk for foodborne transmission infections. Question 3.5: Which age groups reported the highest incidence of E. coli O157:H7? Highest risk age group from 0-9 years old. Based on the population data, can you make a hypothesis about which age group was most at risk for E. coli O157:H7 infections? Why do you think that age group is at higher risk of the infection? Younger age is more vulnerable because their immunity is not yet developed, and their lifestyle makes foodborne transmission infections more easily.


![Legal Dispute Analysis: FCA v ARCH and Others [2021] UKSC 1](/thumb/189783/legal-dispute-analysis-fca-v-arch-and-others-2021-uksc-1.jpg)