Enhancing Influenza Surveillance in Texas: Strategies and Goals

The Future of
Influenza (Flu)
Surveillance in Texas
Emilio Gonzales


Overview
1.
Considerations for Influenza (Flu) Surveillance
2.
Goals for the Upcoming Season and Year
3.
Projected Timeframes
Considerations:
Respiratory Disease Surveillance
•
Structure of influenza surveillance reporter network
•
“Pan-Respiratory” disease surveillance?
•
Idea of expanded sentinel surveillance which incorporates multiple
respiratory diseases
•
COVID-19 surveillance?
•
RSV surveillance and data?
•
Increasing participation and associated data management
•
Influenza Sequencing Center
Goals for 23-24 Flu Season
1.
Increasing participation
a.
NREVSS
(National Respiratory and Enteric Virus
Surveillance System)
b.
ILINet
(Influenza-Like Illness Network)
c.
Public Health Lab (PHL) Sample Submissions
2.
Improved Outbreak Reporting
3.
Better Data Visualization and Access
Increasing Flu Surveillance
Participation
•
NREVSS
•
33 reporters currently (22-23 Season)
•
Largest percentage of testing comes from PHR 3 and 7
•
26% and 24% respectively
•
GOAL:
•
Increase reporters by 7, to bring us to 40 reporters
•
Target areas with lower reporting
•
ILINet
•
65 reporters currently (22-23 Season)
•
GOAL:
•
Increase reporters by 15, to bring us to 80 reporters
•
Target areas with lower participation
Increasing Flu Surveillance
Participation
•
PHL sample submissions
•
22-23 Season to Date
•
3676 specimens tested, 525 positives
•
Right Size Goals for Novel Influenza Detection
•
182 positives per week during peak (>4 weeks)
•
52 positives per week during ‘shoulders’ (weeks 40-20)
•
1 positives per week during summer (year-round)
•
GOAL:
•
Aim to meet Right Size novel testing outlined above
•
Additional aim for Sequencing Center
•
90 specimens tested per week (weeks 40-39 / the year)
•
Avg. of 10 positives per week (weeks 40-39/ the year)
Improving Outbreak Reporting
•
Working towards a more streamlined reporting
•
Qualtrics/Survey based report
•
Initial scaled down report for providers
•
Follow-up completed by local health jurisdiction
•
Reminding and educating providers, schools, facilities of
what constitutes and outbreak
•
Required reporting
Respiratory Disease Data
Visualization and Access
•
Influenza Dashboard
•
Historical data (~5 years)
•
Interactive visualizations
•
Regional breakout of data
•
Predictive model for influenza
•
Includes other respiratory diseases
•
RSV, Adenovirus, Parainfluenza, etc.
•
Aim to utilize data dashboard to inform health departments
(HD’s), providers, and the public
*preliminary sample of influenza dashboard, material has likely changed
*preliminary sample of influenza dashboard, material has likely changed
*preliminary sample of influenza dashboard, material has likely changed
*preliminary sample of influenza dashboard, material has likely changed
*preliminary sample of influenza dashboard, material has likely changed
Projected Timeframes
1.
Dashboard Completed by October, fully launched
by 2024
2.
Updated Influenza Surveillance Handbook by
October, 2023
3.
Outbreak Report Survey by January 2024
4.
Ongoing efforts for increased recruitment and
participation in influenza surveillance
Thank You
Emilio Gonzales
Emilio.gonzales@dshs.texas.gov
flutexas@dshs.texas.gov
Slide
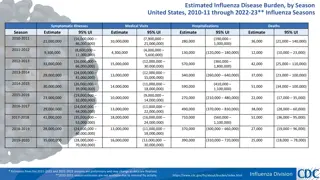
Emilio Gonzales presents a comprehensive plan for advancing influenza surveillance in Texas, focusing on considerations, goals for the upcoming flu season, and strategies to increase participation in surveillance programs. The plan includes enhancing respiratory disease surveillance, expanding sentinel surveillance, improving outbreak reporting, and increasing data visualization and access. Key targets include boosting participation in surveillance networks and increasing sample submissions for novel influenza detection. Efforts are also underway to streamline outbreak reporting processes for better monitoring and response.

Download Presentation

Please find below an Image/Link to download the presentation.
The content on the website is provided AS IS for your information and personal use only. It may not be sold, licensed, or shared on other websites without obtaining consent from the author. Download presentation by click this link. If you encounter any issues during the download, it is possible that the publisher has removed the file from their server.
E N D
Presentation Transcript
The Future of Influenza (Flu) Surveillance in Texas Emilio Gonzales
Overview 1.Considerations for Influenza (Flu) Surveillance 2.Goals for the Upcoming Season and Year 3.Projected Timeframes
Considerations: Respiratory Disease Surveillance Structure of influenza surveillance reporter network Pan-Respiratory disease surveillance? Idea of expanded sentinel surveillance which incorporates multiple respiratory diseases COVID-19 surveillance? RSV surveillance and data? Increasing participation and associated data management Influenza Sequencing Center
Goals for 23-24 Flu Season 1.Increasing participation a.NREVSS (National Respiratory and Enteric Virus Surveillance System) b.ILINet (Influenza-Like Illness Network) c. Public Health Lab (PHL) Sample Submissions 2. Improved Outbreak Reporting 3.Better Data Visualization and Access
Increasing Flu Surveillance Participation NREVSS 33 reporters currently (22-23 Season) Largest percentage of testing comes from PHR 3 and 7 26% and 24% respectively GOAL: Increase reporters by 7, to bring us to 40 reporters Target areas with lower reporting ILINet 65 reporters currently (22-23 Season) GOAL: Increase reporters by 15, to bring us to 80 reporters Target areas with lower participation
Increasing Flu Surveillance Participation PHL sample submissions 22-23 Season to Date 3676 specimens tested, 525 positives Right Size Goals for Novel Influenza Detection 182 positives per week during peak (>4 weeks) 52 positives per week during shoulders (weeks 40-20) 1 positives per week during summer (year-round) GOAL: Aim to meet Right Size novel testing outlined above Additional aim for Sequencing Center 90 specimens tested per week (weeks 40-39 / the year) Avg. of 10 positives per week (weeks 40-39/ the year)
Improving Outbreak Reporting Working towards a more streamlined reporting Qualtrics/Survey based report Initial scaled down report for providers Follow-up completed by local health jurisdiction Reminding and educating providers, schools, facilities of what constitutes and outbreak Required reporting
Respiratory Disease Data Visualization and Access Influenza Dashboard Historical data (~5 years) Interactive visualizations Regional breakout of data Predictive model for influenza Includes other respiratory diseases RSV, Adenovirus, Parainfluenza, etc. Aim to utilize data dashboard to inform health departments (HD s), providers, and the public
*preliminary sample of influenza dashboard, material has likely changed
*preliminary sample of influenza dashboard, material has likely changed
*preliminary sample of influenza dashboard, material has likely changed
*preliminary sample of influenza dashboard, material has likely changed
*preliminary sample of influenza dashboard, material has likely changed
Projected Timeframes 1.Dashboard Completed by October, fully launched by 2024 2.Updated Influenza Surveillance Handbook by October, 2023 3.Outbreak Report Survey by January 2024 4.Ongoing efforts for increased recruitment and participation in influenza surveillance
Thank You Emilio Gonzales Emilio.gonzales@dshs.texas.gov flutexas@dshs.texas.gov


![Preventing Influenza at [Name of Critical Access Hospital]](/thumb/233818/preventing-influenza-at-name-of-critical-access-hospital.jpg)