Energy Balance Comparison: Dominican Republic vs. Viet Nam 2018
Analyzing the energy balance figures for 2018 of the Dominican Republic and Viet Nam based on IEA data in ktoe. The supply, production, final consumption, conversions, and efficiency metrics are compared to understand the energy landscape in both countries.

Download Presentation

Please find below an Image/Link to download the presentation.
The content on the website is provided AS IS for your information and personal use only. It may not be sold, licensed, or shared on other websites without obtaining consent from the author. Download presentation by click this link. If you encounter any issues during the download, it is possible that the publisher has removed the file from their server.
E N D
Presentation Transcript
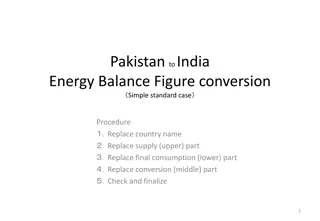
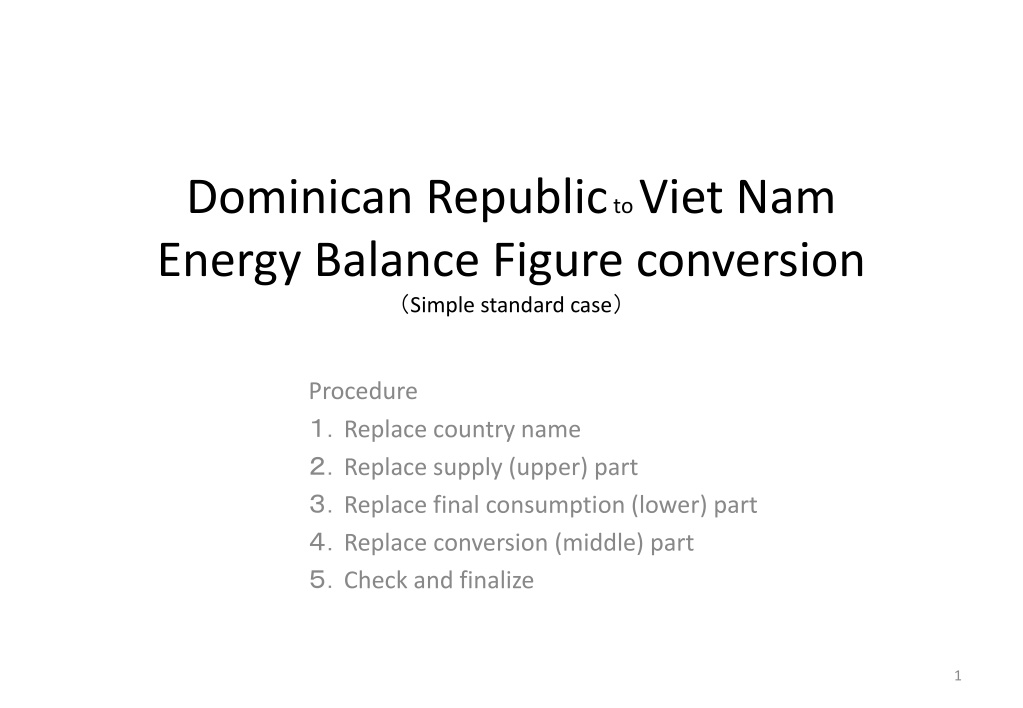
Dominican Republic to Viet Nam Energy Balance Figure conversion Simple standard case Procedure Replace country name Replace supply (upper) part Replace final consumption (lower) part Replace conversion (middle) part Check and finalize 1
Dominican Republic Energy Balance 2018, by IEA data (ktoe) Production | Trade Primary Energy Supply 9229 0 1302 0 5153 0 223 0 1026 930 0 1168 27 3 Crude Oil 1278 Hydro & RE 223 Biofuels & waste 928 Oil Natural Gas 1012 Coal Product 4606 1183 8 On-site solar 601 2019 1337 49 80 906 Net Eff. 39.2 Power Plant 1415 Loss 219 13.4 Eff. 88.0 Refinery Interme diate Supply 1220 475 3710 106 788 1411 FC/PES =70.4% Final Consum ption 6498 2 407 495 444 370 89 97 0 16 516 On site 2441 5 475 278 498 270 89 7 Industrial Commercial Transport Others Residential 1610 1462 2462 502 461
Viet Nam Energy Balance 2018, by IEA data (ktoe) Production | Trade Viet Nam supply part Primary Energy Supply 83455 7278 148 11712 13596 13203 5270 1360 13596 2241 23735 7941 8911 0 63 Crude Oil 12937 Biofuels & waste 8911 Oil Natural Gas 7941 Hydro & RE Electri city Coal Product 9563 36740 7278 85 601 2019 1337 49 80 906 Net Eff. 39.2 Power Plant 1415 Loss 219 13.4 Eff. 88.0 Refinery Interme diate Supply 1220 475 3710 106 788 1411 FC/PES =70.4% Final Consum ption 6498 2 407 495 444 370 89 97 0 16 516 On site 2441 5 475 278 498 270 89 7 Industrial Commercial Transport Others Residential 1610 12937 2462 502 461
Viet Nam Energy Balance 2018, by IEA data (ktoe) Production | Trade Primary Energy Supply 83455 7278 148 11712 13596 13203 5270 1360 13596 2241 23735 7941 8911 0 63 Crude Oil 12937 Biofuels & waste 8911 Oil Natural Gas 7941 Hydro & RE Electri city Coal Product 9563 36740 7278 85 601 2019 1337 49 80 906 Interme diate Supply Net Eff. 39.2 Power Plant 1415 Loss 1266 Eff. 88.0 Refinery 1220 7.2 Viet Nam final consumption part 8083 20750 14172 985 FC/PES =72.2% 16284 Final Consum ption 60273 1917 12058 475 684 2213 329 1341 848 13 815 5352 4 1680 117954618 9609 5541 981 Industrial Commercial Transport Others Residential 32545 10059 12063 2743 2873
Viet Nam Energy Balance 2018, by IEA data (ktoe) Production | Trade Primary Energy Supply 83455 7278 148 11712 13596 13203 5270 1360 13596 2241 23735 7941 8911 0 63 Crude Oil 12937 Biofuels & waste 8911 Oil Natural Gas 7941 Hydro & RE Electri city Coal Product 9563 36740 7278 85 Viet Nam conversion part 52 10991 22567 65 6885 Interme diate Supply Net Eff. 34.4 Power Plant 10187 Loss 1266 Eff. 93.0 Refinery Statistical differences 2731 10217 7.2 8083 20750 14172 985 FC/PES =72.2% 16284 Final Consum ption 60273 1917 12058 475 684 2213 329 1341 848 13 815 5352 4 1680 117954618 9609 5541 981 Industrial Commercial Transport Others Residential 32545 10059 12063 2743 2873
Viet Nam Energy Balance 2018, by IEA data (ktoe)finalization Production | Trade Primary Energy Supply 83455 7278 23735 148 11712 13596 13203 5270 1360 13596 2241 7941 8911 0 63 Crude Oil 12937 Biofuels & waste 8911 Oil Natural Gas 7941 Hydro & RE Electri city Coal Product 9563 36740 7278 85 52 10991 22567 65 6885 Interme diate Supply Net Eff. 34.4 Power Plant 10187 Loss 1266 Eff. 93.0 Refinery Statistical differences 2731 10217 7.2 8083 20750 14172 985 FC/PES =72.2% 16284 Final Consum ption 60273 1917 12058 475 684 329 1341 848 13 815 5352 4 2213 1680 117954618 9609 5541 981 Industrial Commercial Transport Others Residential 32545 10059 12063 2743 2873

")
")
")
")