Comparison of Energy Balance Figures Between Pakistan and India in 2018
Energy balance figures for Pakistan and India in 2018 show significant differences in primary energy supply, production, and final consumption. Pakistan's energy mix includes natural gas, crude oil, and biomass, while India relies heavily on crude oil, coal, and renewable energy sources like hydro and electricity. The final consumption patterns also vary between the two countries, with different allocations for residential, transportation, industrial, commercial, and other sectors.
Download Presentation

Please find below an Image/Link to download the presentation.
The content on the website is provided AS IS for your information and personal use only. It may not be sold, licensed, or shared on other websites without obtaining consent from the author. Download presentation by click this link. If you encounter any issues during the download, it is possible that the publisher has removed the file from their server.
E N D
Presentation Transcript
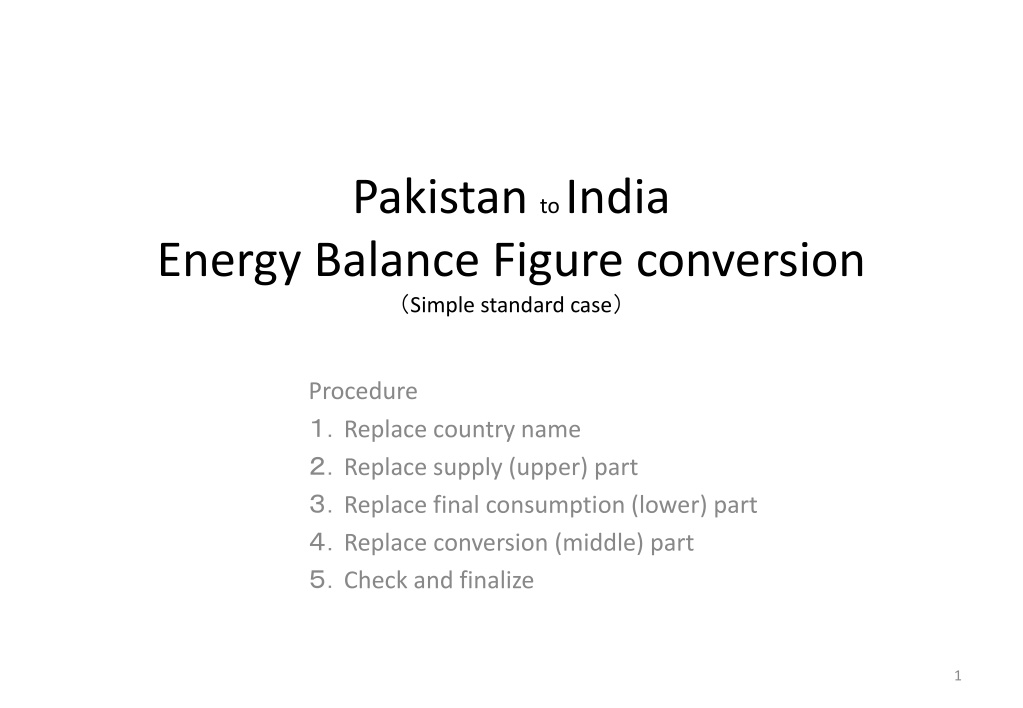
Pakistan to India Energy Balance Figure conversion Simple standard case Procedure Replace country name Replace supply (upper) part Replace final consumption (lower) part Replace conversion (middle) part Check and finalize 1
Pakistan Energy Balance 2018, by IEA data ktoe Production | Trade Primary Energy Supply 111285 3561 18587 10339 1814 2724 380 9562 9720 36373 48 4905 1049 15992 Natural Gas 28307 Crude Oil 14863 Oil Biomass &Waste 36373 Hydro & RE 3561 Elect ricity 48 Nuc. Coal Product 14032 2724 899 11376 14261 270 205 2734 6587 11190 450 Eff. 95.0 Convers ion Net Eff. 38.2 Power Plant Refinery 8002 13997 7933 21937 2062 (loss) 16.5 33262 20071 FC/PES =85.9% 10448 Final Consum ption 95594 619 6456 5279 31298 806 1495 755 17668 2684 1658 7933 1910 7681 3907 933 990 3520 Residential Transport Industry Commercial Others 2 24116 3057 19326 5444 43651
India Energy Balance 2018, by IEA data ktoe Production | Trade India supply part Primary Energy Supply 919441 22941 25872 40021 9853 231480 25534 330 185098 2 65208 123528564 288774 33154 Natural Gas 52406 Crude Oil 271006 Oil Biomass &Waste 185105 Hydro & RE Elect ricity 330 Nuc. Coal Product 35754 9853 3251 22941 414214 14261 270 205 2734 6587 11190 450 Eff. 95.0 Convers ion Net Eff. 38.2 Power Plant Refinery 8002 13997 7933 21937 2062 (loss) 16.5 33262 20071 FC/PES =85.9% 10448 Final Consum ption 95594 619 6456 5279 31298 806 1495 755 17668 2684 1658 7933 1910 7681 3907 933 990 3520 Residential Transport Industry Commercial Others 3 24116 3057 19326 5444 43651
India Energy Balance 2018, by IEA data ktoe Production | Trade Primary Energy Supply 919441 22941 25872 40021 9853 231480 25534 330 185098 2 65208 123528564 288774 33154 Natural Gas 52406 Crude Oil 271006 Oil Biomass &Waste 185105 Hydro & RE Elect ricity 330 Nuc. Coal Product 35754 9853 3251 22941 414214 1002 14261 270 205 2734 6587 11190 450 Eff. 95.0 Convers ion On-site Net Eff. 38.2 Power Plant Refinery 8002 13997 2062 (loss) India final consumption part 16.5 106612 207696 155559 32416 103295 FC/PES =66.0% Final Consum ption 606580 27927117826484115438 801 2698 1564 878 98067 3258 9421231043 6667 41935 32170 On-site 2698 19352 50 23817 5067 7072 2773 1963 1495 90 47886 On-site On-site On-site 60 Residential Transport Industry Commercial Others 4 206087 26027 103767 96173 174527
India Energy Balance 2018, by IEA data ktoe Production | Trade Primary Energy Supply 919441 22941 25872 40021 9853 231480 25534 330 185098 2 65208 123528564 288774 33154 Natural Gas 52406 Crude Oil 271006 Oil Biomass &Waste 185105 Hydro & RE Elect ricity 330 Nuc. Coal Product 35754 9853 22941 414214 3251 India conversion part 1002 6828 16218 270754 284969 4178 15462 25640 Eff. 91.1 Convers ion On-site Net Eff. 30.8 Power Plant Refinery 10 646 267620 23211 (loss) 18.3 106612 207696 155559 32416 FC/PES =66.0% 103295 Final Consum ption 606580 27927117826484115438 801 2698 1564 878 98067 3258 9421231043 6667 41935 32170 On-site 2698 19352 50 23817 5067 7072 2773 1963 9494 90 47886 On-site On-site On-site 60 Residential Transport Industry Commercial Others 5 206087 26027 103767 96173 174527
India Energy Balance 2018, by IEA data ktoe finalization Production | Trade Primary Energy Supply 919441 22941 25872 40021 9853 231480 25534 330 185098 2 123528564 65208 288774 33154 Natural Gas 52406 Crude Oil 271006 Oil Biomass &Waste 185105 Hydro & RE Elect ricity 330 Nuc. Coal Product 35754 9853 22941 414214 3251 1002 6828 16218 270754 284969 4178 15462 25640 Eff. 91.1 Convers ion On-site Net Eff. 30.8 Power Plant Refinery 10 646 267620 23211 (loss) 18.3 106612 207696 155559 32416 103295 FC/PES =66.0% Final Consum ption 606580 27927117826484115438 801 2698 1564 878 98067 3258 9421231043 6667 41935 32170 On-site 2698 19352 50 23817 5067 7072 2773 1963 9494 90 47886 On-site On-site On-site 60 Residential Transport Industry Commercial Others 6 206087 26027 103767 96173 174527
