Socio-Economic Projections for Kigali City: 2013 Master Plan Update
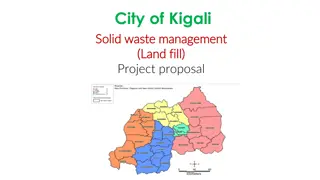
The IPAR Research Conference held on 19th June 2019 and presented by Brian Kiberu showcased the socio-economic projections for Kigali City from 2018 to 2050 as per the 2013 Kigali Master Plan update. The research covered population dynamics, labor market characteristics, GDP growth, economic activities, employment projections, poverty, income inequality, and housing survey findings. Population projections were estimated using the Cohort Component method, and growth projections for sectors in Nyarugenge were also detailed. Additionally, labor market features in Gasabo, Kicukiro, and Nyarugenge districts were analyzed including employment-to-population ratio, unemployment rate, inactivity rate, and types of jobs in the city.
Download Presentation

Please find below an Image/Link to download the presentation.
The content on the website is provided AS IS for your information and personal use only. It may not be sold, licensed, or shared on other websites without obtaining consent from the author.If you encounter any issues during the download, it is possible that the publisher has removed the file from their server.
You are allowed to download the files provided on this website for personal or commercial use, subject to the condition that they are used lawfully. All files are the property of their respective owners.
The content on the website is provided AS IS for your information and personal use only. It may not be sold, licensed, or shared on other websites without obtaining consent from the author.
E N D
Presentation Transcript
IPAR RESEARCH CONFERENCE 19th June 2019, Presented by Brian Kiberu 1 2013 KIGALI MASTER PLAN UPDATE
Socio-economic projections for Kigali City(2018-2050) 2013 KIGALI MASTER PLAN UPDATE
Socioeconomic Indicators Kigali City Population dynamics and projections at district (2018-2050) Labour market characteristics at district and sector level GDP growth and GDP Projections at district level Economic activities at district and sector level Employment Projections by district(2014-2050) Poverty and Income Inequality dynamics Housing Survey Findings 3 2013 KIGALI MASTER PLAN UPDATE
Population Projections Estimation method: Cohort Component method: This method is based on the three components that drive population change namely; fertility, mortality and migration. (Used in NISR projections) Average growth rate generated for Rwanda through NISR estimates was adopted and Projected. 2,050 2,018 2,038 2,048 District Nyarugenge 244,594 Urban Rural 80,618 Urban 244,594 Rural 80,618 Urban 426,496 Rural 140,573 Urban 443,155 Rural 146,064 Scenario Low Gasabo 417,567 187,646 417,567 187,646 733,359 329,556 762,005 342,429 Kicukiro 319,933 44,141 319,933 44,141 561,887 77,523 583,835 80,551 Medium Nyarugenge 246,633 81,290 246,633 81,290 472,367 155,692 493,609 162,694 Gasabo 421,047 189,209 421,047 189,209 806,417 362,387 842,680 378,683 Kicukiro 322,599 44,508 322,599 44,508 617,863 85,245 645,647 89,079 High Nyarugenge 246,633 81,290 246,633 81,290 504,142 166,165 528,722 174,267 Gasabo 421,047 189,209 421,047 189,209 860,661 386,763 902,625 405,621 Kicukiro 322,599 44,508 322,599 44,508 659,424 90,980 691,576 95,416 4 2013 KIGALI MASTER PLAN UPDATE
Population Growth Projections for sectors in Nyarugenge 3,000,000 2,500,000 2,000,000 Gitega Kanyinya Kigali Kimisagara Mageragere 1,500,000 Muhima Nyakabanda Nyamirambo Nyarugenge Rwezamenyo 1,000,000 500,000 0 2012 2018 2023 2028 2033 2038 2043 2048 2049 2050 5 2013 KIGALI MASTER PLAN UPDATE
Labour Market features Kigali City District Gasabo Kicukiro Nyarugenge Period 2010 2014 2010 2014 2010 2014 Employment to Population ratio 72.8 73.3 69.2 69.2 65.7 66.6 Unemployment rate 9.1 9.8 12.8 11.4 12.6 12.9 Inactivity rate 19.9 18.6 20.6 21.7 24.8 23.5 Time related Underemployment rate 25.8 19.2 15 16.1 11.7 17.4 Table 9:Type of jobs in City of Kigali District Total Wage Farm Wage Non- farm Independent farmer Independent non-farmers Unpaid non farmer Gasabo 3.8 53.3 20.9 20.4 1.6 100 Kicukiro 1.9 62.8 9.5 22.5 3.4 100 Nyarugenge 1.7 55.2 10.1 29.3 3.6 100 Source: Integrated Household Living Conditions 2010, 2014 6 2013 KIGALI MASTER PLAN UPDATE
Economic Activity in Kigali City 2005 GDP (Rwf) Distri ct 2013 GDP (Rwf) Populatio n Percapit a (Rwf) 2013 Percapita GDP USD 2013 2015 GDP (Rwf) Population 2015 Percapita (Rwf) 2015 Percapita GDP USD 2015 Average Annual Growth rates (%) (2005- 2013) Gasab o 114,954,898,906 552,919 554,016 858 633,742 532,025 760 4.91 306,326,117,64 7 337,166,744, 990 Kicuk iro 85,302,220,261 341,992 1,676 386,569 1,135,765 1,623 8.88 370,357,564,23 5 1,082,94 2 439,051,726, 853 Nyaru genge 68,828,755,036 287,615 688,055 1,065 301,852 733,677 1,048 5.79 197,894,880,00 0 221,461,969, 134 Projected Growth rate-Rwanda 10 9 8 7 6 5 Forecasted Growth rate 4 3 2 1 0 Source: Integrated Household Living Conditions 2010, 2014 2014 2015 2016 2017 2018 2019 2020 2021 2022 2023 7 2013 KIGALI MASTER PLAN UPDATE
District GDP Estimation and Projections The World Bank (2014) used the lights intensity approach for individual districts to estimate economic activity in individual districts ILO (2016) used the Expenditure approach to estimate the individual economic activities. Limitations Lack of electricity in rural areas limits the scope of the Light Intensity Approach Expenditure approach didn t account for district exports and imports because of unavailability of data Labour productivity approach Sums up incomes generated by different factors of production in households. Approach sums up all income of labour units that reported to have been employed in the three household surveys of 2002, 2010 and 2014 8 2013 KIGALI MASTER PLAN UPDATE
Economic Activity in Kigali City Kigali Districts GDP Projections 2018-2050 6,000,000,000,000 5,000,000,000,000 4,000,000,000,000 3,000,000,000,000 2,000,000,000,000 1,000,000,000,000 0 2013 FRW GDP 2018 FRW GDP 2023 FRW GDP 2028 FRW GDP 2033 FRW GDP 2038 FRW GDP 2043 FRW GDP 2048 FRW GDP 2050 FRW GDP Gasabo Kicukiro Nyarugenge Source: Integrated Household Living Conditions 2010, 2014 9 2013 KIGALI MASTER PLAN UPDATE
District Employment Projection Employment elasticity of growth explains the change in employment resulting from changes in economic growth. Arc elasticity The Arc Elasticity method requires cross-sectional data of percentage change in employment (numerator) and percentage change in GDP growth (denominator) for two periods. Arc employment elasticities calculated using this method tend to exhibit a great deal of instability Point elasticity This is preferred because it irons out volatility associated with arc elasticity. This is computed using econometrically generated behaviours between variables. Random effects model was used because it accounts for three sources of residuals in a regression namely time related error, cross-section related error and white noise obtaining efficient estimates. 10 2013 KIGALI MASTER PLAN UPDATE
Table 28:District Projected Total Employment Employment Projections for Kigali City = = + ln ln ln . 6 . 6 . 6 = 34 34 34 ln . 0 . 0 . 0 + E 21 188 398 . 6 = E E E Y City of Kigali:- -----------------------------(i) it it Y Y 34 Nyarugenge:- ---------------------------(ii) it it Gasabo:- Kicukiro:- ---------------------------(iii) Y 1615 . 0 -------------------------(iv) it it it it District Actual Employme nt in 2014 Projectede d Employme nt in 2019 Projected Employme nt in 2024 Projected Employme nt in 2029 Projected Employme nt in 2034 Projected Employme nt in 2039 Projected Employme nt in 2044 Projected Employment in 2050 Nyarugen ge 137,427 170,070 200,559 228,895 255,076 279,103 300,976 320,185 Gasabo 289,308 300,707 409,829 528,221 655,884 792,817 939,020 1,096,629 Kicukiro 153,234 190,888 224,499 254,893 282,070 306,030 326,772 343,471 City of Kigali 579,969 661,665 834,887 1,012,009 1,193,030 1,377,950 1,566,768 1,760,285 Source: Integrated Household Living Conditions 2010, 2014 12 2013 KIGALI MASTER PLAN UPDATE
Poverty and income inequality Table 1:Poverty Levels in City of Kigali Districts Period 2012 2015 2012 2015 2012 2015 Source: Living Household Condition Survey 2010, 2014 District Nyarugenge Extremely Poor 0.022 0.068 0.095 0.090 0.019 0.055 Poor 0.042 0.102 0.098 0.100 0.034 0.086 Total Poor 0.064 0.170 0.193 0.190 0.053 0.141 Non Poor 0.936 0.830 0.807 0.810 0.970 0.859 Gasabo Kicukiro Poverty levels in City of Kigali are generally low compared to national poverty rates that reduced from 44% to 39% in the period under review Gasabo district has majority of the poor people within City of Kigali with minimal decline in the period under review Nyarugenge and Kicukiro have low poverty levels, the proportion of people living in poverty increased from 2012 to 2015 for the two districts reflecting a growing problem of urban poverty 13 2013 KIGALI MASTER PLAN UPDATE
Poverty at sector level within Kigali Districts 100 90 120 80 100 120 70 80 60 100 50 60 80 40 60 40 30 40 20 20 20 10 0 0 0 Gisozi Jali Kacyiru Gatsata Jabana Bumbogo Ndera Kimironko Kimihurura Remera Rusororo Gikomero Rutunga Kinyinya Nduba Not Poor Poor Not Poor Distribution of Non Poor and Non Poor in Kicukiro District Geographical Sectors Not Poor Poor Distribution of Non Poor and Poor in Nyarugenge District Distribution of Non Poor and Poor in Gasabo District Figure 1:Poverty Hotspots in Districts within City of Kigali Districts 14 2013 KIGALI MASTER PLAN UPDATE
I Income Inequality ncome Inequality 1 1 cumulative outcome proportion cumulative outcome proportion .8 .8 .6 .6 .4 .4 .2 .2 0 0 0 20 40 60 80 100 0 20 40 60 80 100 population percentage population percentage L(p) 95% CI L(p) 95% CI Figure 5:Income Inequality in Nyarugenge District from 2010 to 2014 1 1 cumulative outcome proportion cumulative outcome proportion .8 .8 .6 .6 .4 .4 .2 .2 0 0 0 20 40 60 80 100 0 20 40 60 80 100 population percentage population percentage L(p) 95% CI L(p) 95% CI Figure 6: Income Inequality in Gasabo District from 2010 to 2014 1 1 cumulative outcome proportion cumulative outcome proportion .8 .8 .6 .6 .4 .4 .2 .2 0 0 0 20 40 60 80 100 0 20 40 60 80 100 population percentage population percentage L(p) 95% CI L(p) 95% CI Figure 7: Income Inequality in Kicukiro District from 2010 to 2014 15 2013 KIGALI MASTER PLAN UPDATE
Housing Dynamics in City of Kigali
Outline Section A:- Features of Housing and Transportation Section B:- Housing Demand Determinants Section C:- Housing Affordability 9/7/2024 17
Section A Features of Housing and Transportation 9/7/2024 18
A.1. Building Material for Houses in City of Kigali Other 0.2 Asbestos sheet 0.26 Concrete 0.3 Clay tiles 2.92 Corrugated iron sheets 96.32 0 20 40 60 80 100 120 1.04 Other 62.87 Cement floor 18.42 Tiled floor 17.67 Earth/clay 0 10 20 30 40 50 60 70 9/7/2024 19
A.2. Land Ownership and certificate of Ownership 90 78.75 80 70 60 50 40 30 21.25 20 10 0 Own land Don t Own Land 9/7/2024 20
A.3. Cost of Construction of houses in Kigali Variable Median Cost (Rwf) Average Cost (Rwf) Coefficient of Variation (%) Cost of Construction 12,000,000 21,000,000 2.77925800 Value of Property (land and house) 20,000,000 54,200,000 variable Median size of Resident houses in Kigali City Mean CV Size of house 1 1.25 0.6106 9/7/2024 21
A.4. Future Location Preferences In which location do you plan to build or occupy a house in 5 to 10 years Percent Expanding our current residential place 22.18 In another plot within same sector 13.82 In another district within Kigali City 6.77 Outside Kigali city 4.36 None 52.87 Total 100 1.57 0.45 Whole house 3.4 7.89 Part of a house under share within an apartment building Bungalow 86.69 Other: Specify 9/7/2024 22
A.5. Information Need by Households Ranking Would Like to receive information about City and District Master Plan (%) The City of Kigali and District Master Plan are an important tool to (%) In the case City of Kigali will organize events to inform above the City (%) More efforts need to be taken in order to sensitize and engage local citizens (%) Strongly Agree Agree Disagree Strongly Disagree Total 39.98 58.53 1.3 0.19 100 38.89 56.51 4.01 0.58 100 40.6 58.05 1.22 0.13 100 38.2 59.56 2.1 0.13 100 What are the main sources of information on public events Radio Television Newspaper Community meetings Fellow citizens around my neighbourhood Sensitization from Local leaders City of Kigali enforcement officers Social media Billboards Notice board Internet Other Percent 16.98 13.63 0.58 25.77 4.97 29.99 0.27 2.1 0.05 0.19 1.12 4.36 9/7/2024 23
A.6. Transportation Dynamics Distance to work place by District (%) Distance to Nearest School (%) More than 10Km 7.2 6.8 15.2 0.56 0.32 0.21 More than 10Km 5 to 10 km 8.1 9.4 11.7 2 2 1 5 to 10 km 2 to 5km 12.3 9.5 9.1 13 10 9 2 to 5km 1km to 2 km 14.7 15.1 10.2 22 20 16 1km to 2 km 500m to 1 km 17.6 22.1 21.0 37 38 38 500m to 1 km Less than 500 m 40.1 37.2 32.9 0.0 20.0 40.0 60.0 80.0 100.0 120.0 25 30 35 Less than 500 m 0 20 40 60 80 100 120 Gasabo Nyarugenge Kicukiro Gasabo Nyarugenge Kicukiro 9/7/2024 24
A.6.1. Transportation: Current Mode of Transport (%) 22 9 8 Kicukiro 2 59 5 14 4 Nyarugenge 2 75 11 10 5 Gasabo 2 72 0 10 20 30 40 50 60 70 80 Private car Public transport (Buses and taxis) Motorcycle Cycling Walking Current Mode of Transportation to Workplace% 9/7/2024 25
A.6.2. Transportation for Households (%) 22 9 8 Kicukiro 2 59 5 14 4 Nyarugenge 2 75 11 10 5 Gasabo 2 72 0 10 20 30 40 50 60 70 80 Private car Public transport (Buses and taxis) Motorcycle Cycling Walking Current Mode of Transportation to Workplace% Kicukiro Nyarugenge Gasabo 0.0 10.0 20.0 30.0 40.0 50.0 60.0 70.0 80.0 Private car Public transport (Buses and taxis) Motorcycle Cycling Walking Mode of transportation households would like to upgrade to (%) 9/7/2024 26
A.6.3. Distance to Nearest School and Cost of Transportation District Mean Cost Frw Median Cost FRW Cv Min FRW Max FRW Distance to Nearest School (%) 40 37 Gasabo 790 500 1.14 10 6500 37 37 35 33 28 30 Nyarugenge 877 500 1.36 0 5200 24 25 22 22 Kicukiro 1285 600 1.14 0 7000 19 20 15 15 10 9 10 5 2 2 1 0.77 0.42 0.30 0 Gasabo Nyarugenge Kicukiro Less than 500 m 500m to 1 km 1km to 2 km 2 to 5km 5 to 10 km More than 10Km 9/7/2024 27
Section B Housing Demand Determinants 9/7/2024 28
B.1. B.1. Housing Demand Determinants in City of Kigali Housing Demand Determinants in City of Kigali Explanatory variables Robust Coef. Std. Err. Z P>z Annual Income 0 0 -0.44 0.658 Male (Gender) -0.1325 0.0528 -2.51 0.012 Fulltime Employment 0.287 0.0918 3.13 0.002 Self-Employment 0.0206 0.0576 0.36 0.72 Occasional Employment 0.1419 0.0943 1.5 0.132 Retirees (Employees) -1.476 0.2439 -6.05 0 have children -0.4149 0.0535 -7.76 0 Education_ Primary Incomplete 0.3289 0.1109 2.97 0.003 Education_ Primary Completed 0.325 0.11 2.95 0.003 Education_ Secondary Not Completed 0.5747 0.1144 5.02 0 Education_ Secondary Completed 0.7714 0.1133 6.81 0 Education_ Vocational Training 0.3647 0.158 2.31 0.021 Education_ University (BA) 0.6025 0.1248 4.83 0 Education-University (Masters & PhD) 0.3767 0.2164 1.74 0.082 Have residence out of Kigali 0.2275 0.0966 2.36 0.018 Want to migrate out of Kigali 0.6308 0.0921 6.85 0 Ubudehe category 2 -0.0235 0.0906 -0.26 0.795 Ubudehe category 3 -0.1934 0.089 -2.17 0.03 Ubudehe category 4 -1.1438 0.2977 -3.84 0 9/7/2024 29
B.2. Magnitudes (Impact) Explanatory variables dy/dx Std. Err. Z P>z Annual Income 4.83e-09 9.41e-09 0.51 0.608 Male (Gender) -.0400667 .013591 -2.95 0.003 Fulltime Employment .0753679 .0240448 3.13 0.002 Self-Employment -.0021484 .0149671 -0.14 0.886 Occasional Employment .0303596 .0236118 1.29 0.199 Retirees (Employees) -.3293 .0694885 -4.74 0.000 have children -.1010314 .0136832 -7.38 0.000 Education_ Primary Incomplete .0988316 .0272434 3.63 0.000 Education_ Primary Completed .094853 .0269292 3.52 0.000 Education_ Secondary Not Completed .1625611 .0278447 5.84 0.000 Education_ Secondary Completed .2155128 .0276061 7.81 0.000 Education_ Vocational Training .1183536 .0390754 3.03 0.002 Education_ University (BA) .1637899 .0302196 5.42 0.000 Education-University (Masters & PhD) .1086477 .053936 2.01 0.044 Have residence out of Kigali .0739962 .0248954 2.97 0.003 Want to migrate out of Kigali .1743109 .0242959 7.17 0.000 Ubudehe category 2 .005394 .0234455 0.23 0.818 Ubudehe category 3 -.0342693 .0227179 -1.51 0.131 Ubudehe category 4 -.3065794 .0750602 -4.08 0.000 9/7/2024 30
Section C Housing Affordability 9/7/2024 31
C.1. C.1. Affordability Dynamics in the City of Kigali (In terms of renting) Affordability Dynamics in the City of Kigali (In terms of renting) Income Quantile Median Income Median Rent Affordability Ratio 1(25%) 20,000 17,500 0.88 2(50%) 70,000 30,000 0.43 3(75%) 170,000 50,000 0.29 4(100%) 500,000 100,000 0.20 Quantile Median Annual Income Median Property Value Rent Affordability ratio 1(25%) 420,000 10,000,000 23.81 2(50%) 1,200,000 25,000,000 20.83 3(75%) 2,640,000 50,000,000 18.94 4(100%) 25,000,000 400,000,000 16.00 9/7/2024 32
C.2. Income Estimates Year Q1 Annual Income Q2 Annual Income Q3 Annual Income Q4 Annual Income 2018 240,000 840,000 2,040,000 6,000,000 2023 247,635 866,724 2,104,900 6,190,883 2028 255,376 893,816 2,170,697 6,384,402 2033 263,359 921,756 2,238,550 6,583,970 2038 271,591 950,569 2,308,524 6,789,776 2043 280,081 980,282 2,380,685 7,002,015 2048 288,836 1,010,924 2,455,102 7,220,889 2050 292,414 1,023,448 2,485,516 7,310,342 9/7/2024 33
C.3. Annual Rent Estimates Year Q1 Median Annual Rent Q2 Median Annual Rent Q3 Median Annual Rent Q4 Median Annual Rent 2018 211,200 361,200 600,066 1,200,000 2023 217,919 372,691 619,156 1,238,177 2028 224,731 384,341 638,510 1,276,880 2033 231,756 396,355 658,469 1,316,794 2038 239,000 408,745 679,052 1,357,955 2043 246,471 421,521 700,279 1,400,403 2048 254,175 434,698 722,168 1,444,178 2050 257,324 440,083 731,115 1,462,068 9/7/2024 34
C.4. Median Value of Affordable House for Tenants YEAR Q1 Median value of affordable house for tenants Q2 Median value of affordable house for tenants Q3 Median value of affordable house for tenants Q4 Median value of affordable house for tenants 2018 5,714,400 17,497,200 38,637,600 96,000,000 2023 5,896,197 18,053,853 39,866,810 99,054,129 2028 6,080,504 18,618,193 41,112,994 102,150,429 2033 6,270,573 19,200,172 42,398,131 105,343,515 2038 6,466,582 19,800,344 43,723,440 108,636,413 2043 6,668,719 20,419,277 45,090,177 112,032,243 2048 6,877,175 21,057,556 46,499,636 115,534,221 2050 6,962,370 21,318,420 47,075,679 116,965,474 9/7/2024 35
C.5. Projected Housing Need by District Projected Housing Need by District (2018-2050) 2024 2031 District 2018 2038 2045 2050 Nyarugenge Total 30374 42721 58453 76,939 104,244 125,020 Gasabo Total 78,271 110,380 151,970 201,533 275,681 335,111 Kicukiro Total 40,983 60,991 86,994 118,053 164,654 202,208 City of Kigali Total 149,629 214,092 297,416 396,525 544,580 662,340 9/7/2024 36
MURAKOZE CYANE 9/7/2024 37


