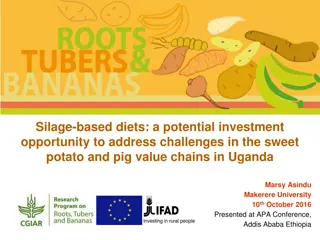
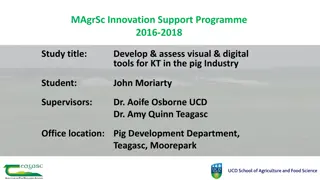
Sustainable Pig Production with Local Protein Feeds
Explore the sustainability of pig production through increased usage of local protein feeds, feeding trials, carbon footprint analysis, and comparisons between soy and rapeseed meal-based diets. The focus is on optimizing feed rations, evaluating economic and environmental impacts, and reducing CO2 emissions associated with pork production.

Download Presentation

Please find below an Image/Link to download the presentation.
The content on the website is provided AS IS for your information and personal use only. It may not be sold, licensed, or shared on other websites without obtaining consent from the author. Download presentation by click this link. If you encounter any issues during the download, it is possible that the publisher has removed the file from their server.
E N D
Presentation Transcript
Sustainability of pig Sustainability of pig production trough increased production trough increased usage of local protein feeds usage of local protein feeds R nno Patune PRIA Meede 16.2
Meat advertisement ban
Feeding trials in Tempo Pllumajandus O Jussi pig farm Dry feeding farm for 1024 pigs. Possibility to feed 2 different formulas same time. Pigs are divided to 4 groups: 1) Feed A, females The objectives of the trials: Analyses of the amino acid composition and nutritional values of local feed materials Optimization of feed rations for growers and finishers using maximum local raw materials Testing feed rations when feeding pigs Evaluation of economic and environmental results 2) Feed A, males 3) Feed B, females 4) Feed B, males
CO2 CO2 eqv meat meat until eqv emissions emissions distribution until the the retail retail gate: distribution of of the gate: the stages stages to to produce produce pork pork
Soy vs rapeseed meal based diets CO2 eqv. Emissions comparison .
Feeding trial CO2 eqv emissions kg/1kg 1.705 1.573 1.473 CO2 eqv. emissions in trial diets (3.11.22- 28.02.23) 1.241 1.221 0.949 0.712 0.698 Starter 2 regular starters low soya grower 1 regular grower 1 low soya grower 2 regular grower 2 NO soya finisher regular finisher NO soya
ANTI-NUTRITIONAL FACTORS of Rapeseed meal rapeseed meal level in no soy grower 2 was 18,07%
Formulas prices and protein levels % Crude protein, % Crude protein, % Crude protein, % Crude protein, % Price, eur Price, eur Price, eur Price, eur Starter 2 Grower1 Grower2 Finisher REGULAR formulas 17.00 392.62 17.14 353.33 16.88 322.27 15.28 292.72 LOW/NO soya formulas 15.67 463.18 16.29 347.36 15.35 314.84 13.42 292.54 . Soya usage decrease per 1 pig in period 21,3- 111,8kg from 25 kg to 6,6 kg Rapeseed usage increase per 1 pig in period 21,3- 111,8kg from 22,4 kg to 28,3 kg Lean meat % was 59,7% in both feeding groups
Growth performance by treatment Feed prices october 2022 All period feed kg eur/pig eur/pig/day Average days total kg residue kg usage kg pigs usage per pig feed price eur/kg feed price feed price increment kg ADG gr/day FCR ADFI 105.0NO/LOW soya feed total 139940 0 139940 485 288.5 0.408 117.6 1.12 91.4 870 3.2 2.75 106.0Regular feed total 141460 0 141460 472 299.7 0.406 121.6 1.15 89.7 846 3.3 2.83 feed kg feed kg feed kg feed kg Total CO2 eqv kg CO2 eqvivalent reduction starter 2 Co2 eqv total grower 1 kg Co2 eqv total grower 2 Co2 eqv total finisher Co2 eqv total Co2 eqv per pig, kg NO/LOW soya feed total 12180 1.573 19159.14 18860 1.221 23028.06 12380 0.698 8641.24 96820.0 0.712 68935.8 119764 246.9 Regular feed total 12200 1.705 20801 21220 1.473 31257.06 12080 1.241 14991.28 95960.0 0.949 91066.0 158115 335.0 Without soya and low prot feed compared with regular feed All period -3.4% cheaper without consider growth speed average daily feed intake ADFI -35.7% lower CO2 eqv emission between body weight 21.3-111.8kg average daily gain ADG -1.0days, growth period feed conversion ratio FCR
Grower 1 formulas Feed prices March 2023 (28-45kg) (28-45kg) GROWER 1 GROWER 1 price eur/t kg 500.00 price eur/t kg 6500.00 REGULAR FORMULA SODIUM-BICARBONATE Price, eur NO SOYA FORMULA q-ColMax Price, eur 0.30 0.10 1.5 6.5 molasses 245.00 1.50 molasses 245.00 1.00 3.7 2.5 triticale 245.00 10.00 24.5 230.00 260.00 7.7 17.7 rye wheat 11 CP wheat 260.00 25.85 50.00 67.2 130.0 barley 245.00 36.41 barley 10.3 CP 245.00 10.00 89.2 24.5 rapeseed cake 31% protein 375.00 rapeseed cake 31/10 375.00 7.00 26.39 26.3 99.0 soyameal 45,5% protein 600.00 soyameal 45,5 CP 600.00 13.80 0.00 82.8 0.0 rapeseed oil 1300.00 2.00 rapeseed oil 1300.00 2.10 26.0 27.3 80.00 0.49 80.00 0.69 limestone MCP limestone MCP 0.4 0.6 1050.00 0.92 1050.00 0.42 9.7 4.4 salt NaCl 149.00 0.30 salt NaCl 149.00 0.50 0.4 0.7 PG STARTER premix 1% 1690.00 1.00 Pig Fattening 0,25% 7800.00 0.25 16.9 19.5 L-LYSINE-HCL 79% 1600.00 0.27 L-LYSINE-HCL 79% 1600.00 0.61 4.3 9.8 METHIONIN 99% 2600.00 0.03 METHIONIN 99% 2600.00 0.04 0.8 1.0 THREONIN 98% 1800.00 0.13 THREONIN 98% 1800.00 0.20 2.3 3.6 TOTAL TOTAL 100.00 355.98 100.00 347.03 CP % 17.14 CP % 16.39
Conclusions 1)Low carbon footprint diets with rapeseed meal as the main protein source at the growing-finishing period improve growth performance and economic costs results (-4,0 /pig) compared to higher carbon footprint diets 2)Low carbon footprint feeding program reduces 35.7% the CO2 eqv emissions of pork meat production (period 21,3-111,8kg) 3)Low carbon footprint feeding program decrease soya usage in grower-finisher period per 1 pig 18,4kg and increase rapeseed usage per 1 pig 5,9kg 4)Low carbon footprint feeding program is similar price as soya based feeding program


")