African Public Debt Management Forum: Risk Management and New Challenges

The 9th Forum on African Public Debt Management delved into risk management and challenges faced by middle offices, with insights shared by Sturla Palsson from the Central Bank of Iceland. The institutional setup, allocation of responsibilities, debt management objectives, and guidelines were discussed, highlighting the importance of maintaining efficient markets and diversifying funding sources.

Uploaded on Sep 14, 2024 | 0 Views
Download Presentation

Please find below an Image/Link to download the presentation.
The content on the website is provided AS IS for your information and personal use only. It may not be sold, licensed, or shared on other websites without obtaining consent from the author. Download presentation by click this link. If you encounter any issues during the download, it is possible that the publisher has removed the file from their server.
E N D
Presentation Transcript
9thForum on African Public Debt Management SESSION 3: RISK MANAGEMENT, THE RESPONSIBILITIES AND NEW CHALLENGES FACING MIDDLE OFFICES Sturla Palsson, Director, Treasury and Market Operations Central Bank of Iceland
Institutional setup Framework for borrowing set in the budget law presented in parliament before the fiscal year Debt management mandate given to Ministry of Finance (MF) by parliament MF can assign the task of borrowing to the Central Bank of Iceland (CBI) CBI act as funding agent for MF Similar setup in Denmark, Norway and many African countries Division of responsibilities between MF and CBI Agreement between FM and CBI on Treasury debt management Guidelines for debt issuance issued by MF Medium Term Debt Strategy
Allocation of responsibilities Responsibility for the DM lies with the MF CBI has a relatively narrow mandate compared to other Nordic DMO s Number of measures taken to prevent a conflict of interest Debt policy vs. monetary policy MF makes final decisions on the most important issues Recommendations presented to Debt Management Committee (DMC) DMO advises the MF on everything relating to the DM The MO unit within the DMO prepares the necessary material and presents it the DMC DMC discusses scenarios and proposals put forward by the DMO MTDS guidelines set by the MF provide the framework for the debt strategy MTDS outlines a 4 year debt strategy and is updated every year The DMO at the CBI is responsible for ensuring that borrowing and debt management issues are carried out in accordance with the strategy
MTDS - Debt management objectives To ensure that the Treasury s financing need and payment obligations are met at the lowest possible long-term cost that is consistent with a prudent risk policy; To ensure that the debt repayment profile accords with the Treasury s long-term debt service capacity and minimizes refinancing risk; To maintain and encourage further development of efficient primary and secondary markets for domestic Treasury securities; To broaden the investor base and diversify funding sources.
MTDS - Debt management guidelines Debt portfolio structure Non-indexed debt 70-90% Indexed debt 15-30% Foreign debt 0-10% Borrowing guidelines Repayment profile: The aim is to have the long-term repayment profile of Treasury securities as smooth as possible and the individual issuances of similar final size.
MTDS - Debt management guidelines Benchmark series: Benchmark issues will be structured so that each series is large enough to ensure effective price formation in the secondary market. The number and size of the series shall take account of Treasury debt. The goal is for each series to have a final size of ISK 40-100 billion, except for two-year bonds, whose minimum final size will be ISK 15 billion. Refinancing percentage: The ratio of Treasury redemptions in any calendar year shall not exceed 15% of GDP. Maturity: The average time to maturity of the debt portfolio shall be at least five years. Deposits: The Treasury s domestic deposit balance with the Central Bank of Iceland shall average ISK 60-70 billion.
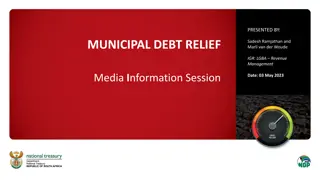
DMO Structure within CBI Debt Management Committee (DMC) Primary Issuance Secondary market Bond lending Policy Strategy Reporting Transaction recording Reconciliation Conformation and settlement Debt servicing and payments Debt data for accounting Middle Back Front Relationship management Market makers Investors Risk management Processes and controls Compliance monitoring Treasury and Mkt. Op. Accounting
DMO Structure in Nordic region Debt Management Committee (DMC) Primary Issuance Secondary market Bond lending Policy Strategy Reporting Transaction recording Reconciliation Conformation and settlement Debt servicing and payments Debt data for accounting Middle Back Front Relationship management Market makers Investors Risk management Processes and controls Compliance monitoring Treasury and Mkt. Op.
Middle office tasks Policy Strategy Reporting Outlined in MTDS Updated on annual basis Prepared by the DMO (MO) Discussed by the DMC Confirmed by the MF Annual issuance calendar Quarterly issuance plan Formulated and designed by the DMO Presented to DMC Confirmed by the FM New product development Research Monthly bulletin Detailed picture of government debt Annual risk report to FM Only in Icelandic for FM Regular DMC meetings with MO presentations
Middle office tasks Risk Process Monitoring Parameters defined in MTDS Market risk Refinancing risk Operational risk Modeling Monitored by DMO Reported to DMC Annual/Quarterly issuance plan DMO acts as Secretariat to DMC who advises FM Compliance Risk limits Trade limits Collateral management Primary dealer performance Annual risk report to MF Regular meetings with DMC Debt sustainability analysis
Required MO skills Market experience Issuance Trading Sales Technical skills Finance Risk Portfolio man. Mathematics and modeling Public policy skills Economics Public sector finance Budget process Communication skills Market makers Investors Front/Back MF/DMC IT skills Software Bloomberg/Reuters Spreadsheets Treasury system
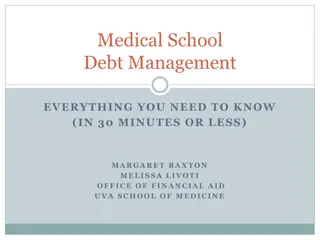
Primary Surplus: Major Step Towards Fiscal Consolidation Surplus Achieved in 2014 Expected to Continue Gross Expenditures on the Decline(1) 40% % of GDP Forecast Forecast % of GDP 5% 35% 3% 30% 1% 25% -1% -3% 20% -5% 15% -7% 10% -9% -11% 5% -13% 0% -15% 2009 2010 2011 2012 2013 2014 2015 2016 2017 2018 2019 2009 2010 2011 2012 2013 2014 2015 2016 2017 2018 2019 Total balance excl. irregular items Total balance Excluding irregular items Iceland Fiscal Consolidation: A Global Comparison Continuous Growth and Improved Debt Levels % of GDP 16.0 Positive primary balance since 2012 5% of GDP in 2014 3.2% estimated in 2015 (due to one-offs) 15.0 14.7 14.2 14.0 12.0 11.3 Overall surplus achieved in 2014 9.6 10.0 8.5 8.5 7.5 8.0 Accumulated surplus of over 8% of GDP expected during the forecast period (2016-19)* 6.0 Expenditures peaked at 34% in 2009 Expected to reduce to 26% by 2019* 4.0 2.0 0.0 Finland 1993 Denmark 1982 Sweden 1993 Iceland 2009 UK 2009 Ireland 1986 UK 1993 Latvia 2009 (1) Excluding irregular items. Sources: Ministry of Finance and Economic Affairs Medium-Term Fiscal Outlook 2015 15
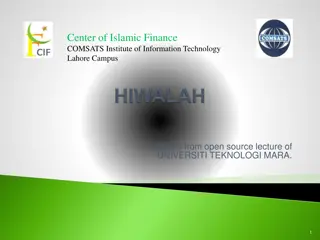
Government Debt Ratio on Declining Trajectory Overview of Government Debt ISK bn % of GDP Forecast 1,800 120% 1,600 100% 1,400 1,200 80% 1,000 800 60% 600 40% 400 200 20% 0 2007 2008 Gross Central Government Debt (LHS) Incremental Municipality Debt (LHS) 2009 2010 2011 2012 2013 2014 2015 2016 2017 2018 2019 -200 0% Net Central Government Debt (LHS) Gross General Government Debt (including Municipalities) to GDP (RHS) Gross Interest Payments ISK bn. % of GDP 100 6% Forecast 90 5% 80 70 4% 60 50 3% 40 2% 30 20 1% 10 0 0% 2007 2008 2009 2010 2011 2012 2013 2014 2015 2016 2017 2018 2019 Interest expenditure, constant price (LHS) Interest expenditure % of GDP (RHS) Source: Ministry of Finance and Economic Affairs - Medium-Term Fiscal Outlook 2015 Notes: Figures exclude loans from IMF and Norway (Central Bank is Borrower and covered within Central Bank reserve fund); and unfunded pension liabilities (ISK408 bn at year-end 2013); adjusted for impact of Nordic drawdown 16
Overview of Government Funding Domestic Debt and Local Currency Largest Parts of Government Debt 250,000 ISK debt represents 72% of the debt portfolio in Dec 2014 200,000 Less need for domestic issuance due to better fiscal outcome ISK mn 150,000 m. kr. Accumulated debt due to funding of fiscal deficit is ISK360bn 100,000 Key investors in domestic securities are: Financial institutions (29%) Foreign investors (20%) Pension funds (28%) Mutual funds (10%) 50,000 0 2015 2016 2017 2018 Other domestic liabilities State guarantees taken over Refinancing of CBI 2019 2020 2021 2022 2023 2024 2025 2026 2027 2028 2029 2030 2031 2032 2033 Central Bank FX Reserves Interest Rate Composition of Debt Portfolio (Dec 2014) ISK million Fixed Inflation- link domestic 17% 160.000 Fixed foreign 25% 140.000 120.000 100.000 80.000 Variable foreign 3% 60.000 40.000 Fixed domestic 29% 20.000 0 Variable domestic 26% 2015 2016 2017 2018 2019 2020 2021 2022 2023 2024 Other foreign loans Bilateral loans Currency reserve loans Source: Ministry of Finance and Economic Affairs - 2015 17
Thank you! For more information: Central Bank: www.cb.is/ Statistics Iceland: www.statice.is/ Iceland bond market: www.bonds.is/ Ministry of Finance: www.fjr.is/ DMO: www.lanamal.is/