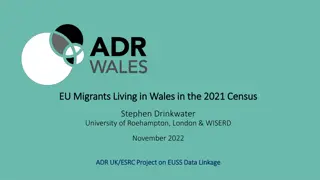
Challenges Faced by Welsh Local Authorities during the Austerity Era
Exploring how Welsh Local Authorities managed the pressures of reduced central funding and increased service demands during the Austerity Era. The study delves into the financial strategies adopted, impacts on income and expenditure, and the unique context of Welsh Government spending. Despite similarities with English counterparts, Welsh LAs face distinct challenges in maintaining financial resilience.

Download Presentation

Please find below an Image/Link to download the presentation.
The content on the website is provided AS IS for your information and personal use only. It may not be sold, licensed, or shared on other websites without obtaining consent from the author. Download presentation by click this link. If you encounter any issues during the download, it is possible that the publisher has removed the file from their server.
E N D
Presentation Transcript
The 12th Annual EIASM Public Sector Conference Public Service Accounting, Accountability and Management Comilla Universidad Pontificia, Madrid, Spain 30th 31st August 2022 Managing the twin pressures in Welsh Local Authorities during the Austerity Era Bernard Kofi Dom, Martin Jones, Alan Collins, & Peter Murphy. Nottingham Business School, Nottingham Trent University.
RQ: How have Welsh Local Authorities managed the twin pressures (reduction in central funding and the continuous increase in demand for services) during the Austerity Era? Structure of this Presentation Research Aims and Why Welsh LAs Welsh Government Income Spending Welsh Context and Government Spending Methods and Methodology Results and Findings Key Discussions Final Thoughts
RQ: How have Welsh Local Authorities managed the twin pressures (reduction in central funding and the continuous increase in demand for services) during the Austerity Era? Research Aims To explore the nature and scale of impacts of austerity on the income and expenditure of Welsh LAs. To investigate the financial strategies adopted by Welsh LAs to absorb or withstand the pressures faced during the austerity era. Why Welsh LAs? A devolved administration, offering an opportunity to study phenomena in a national context. Unlike England, all 22 LAs in Wales are unitary authorities, which makes them more easily comparable. Welsh LAs have some similarities with their English counterparts, which will ultimately allow for comparison between them at a later date. This study forms part of a wider body of work looking at UK LA responses to austerity and the context of financial resilience (Barbera et al., 2017).
Context Welsh Government Income & Spending Barnett Formula 14.7 Bn Twin Pressures? - Reduction in funding (RSG) from the central Government - Continuous increase in expectation and demand for core services
Welsh LA context Studies have explored the state of Local Government Finance in Wales: Often practice-oriented (Ogle et al. 2017; Ifan and Sion 2019; Downes and Taylor-Collins, 2019), but a few academic-oriented (Dollery and Wijeweera, 2010) Austerity was not as severe in Wales as in England (Ogle et al. 2017; Downes and Taylor- Collins, 2019) Some similarities with England, but also some differences (Education/NDR) Good relationship between LAs and Welsh Government (Hay and Martin 2014; Ferry et al. 2017) But .. difficult decisions still to be taken at the local level efficiency, investment and retrenchment (Downes and Taylor-Collins, 2019) Increases in council tax were not sufficient to meet the funding gap (Ifan and Sion, 2019)
Methodology and Methods Exploratory approach quantitative, disaggregated, secondary data (RS/RO Forms) How Welsh LAs prioritised and re-prioritised service expenditure in response to austerity. LAs were grouped into four distinct regions by similar characteristics TV, TSC, NEW, and RoW, as per Crawford et al. (2012) Classified the longitudinal time series into three distinct eras: pre austerity (2005/6 to 2009/10) early austerity (2010/11 to 2014/15) post austerity (2015/16 to 2019/20) All expenditure was converted to the real-term values, using the GDP deflator, with 2010/11 as the base year. Two analysis frames: a trend analysis was conducted to look at how various revenue streams were affected in the time series a proportionate analysis was undertaken to examine how Welsh LAs have (re)prioritised revenue sources in response to the funding pressures.
Welsh LA Income: An overview LA Revenue ( 'm) Change (%) 2005/06 2019/20 Welsh Government Grant 2,674,963 3,229,481 20.7% % of total revenues 67.4% 57.6% -9.8% Council Tax 689,992 1,368,806 98.4% % of total revenues 17.4% 24.4% +7% National Non-Domestic Rates 604,800 1,007,950 66.7% % of total revenues 15.2% 18.0% +2.8% ( Adapted from Ifan and Sion, 2019) Council tax is an increasingly important source of income for councils .. around the time of our interviews, the 2018-19 council tax rates had just been announced, with increases ranging from 3.3- 12.5%. Discussion centred on whether councils were prepared to or had gone above the notional 5% cap set by Welsh Government. Some councils told us that they couldn t afford to keep below the cap, while others were critical of councils which had broken it. (Downe & Taylor-Collins, 2019)
Welsh LAs Income: Scale of Austerity Impacts Welsh LAs Income: Scale of Austerity Impacts
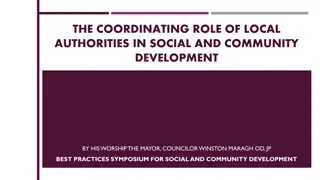
Welsh LA Income: Year-on-Year Changes Council consistently for all Welsh authorities throughout the time series. Tax per capita increased Revenue variable, it consistently declined. Support Grant: Although Business Rates: Fluctuated considerably with a major drop in 2011/12 because of the rebound in 2012/13 and 2013/14 and another drop in 2015/16 TVs had the greatest share of grants; generated lower revenue from council tax throughout the time series.
Impacts of Austerity on Service Expenditure Impacts of Austerity on Service Expenditure
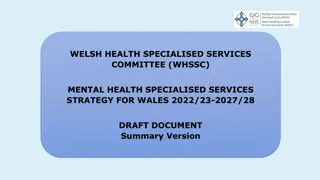
25.00% 20.00% Welsh LAs income: Trend Analysis 15.00% 10.00% Growth in all revenue streams in the pre-austerity era begins to reduce in early austerity. 5.00% TV TV TV TV TV TSC TSC TSC TSC TSC NEW NEW NEW NEW NEW RoW RoW RoW RoW RoW -5.00% 201011 201112 201213 201314 201415 -10.00% 2011/12 saw a drastic reduction in non-domestic rates in all Welsh LA regions. -15.00% 14.00% Welsh Gov't Grant Non-Domestic Rates Council Tax -20.00% 12.00% % change in revenues per head - 2005/06 to 09/10 15.00% 10.00% A reduction in grants in early austerity era continues to the late austerity era. 10.00% 8.00% 6.00% 5.00% Council Tax continued to increase from Early Austerity to Late Austerity. 4.00% TV TV TV TV TV NEW NEW NEW NEW NEW TSC RoW TSC RoW TSC RoW TSC RoW TSC RoW 2.00% 201516 201617 201718 201819 201920 -5.00% TV TV TV TV TV TSC TSC TSC TSC TSC NEW NEW NEW NEW NEW RoW RoW RoW RoW RoW -10.00% 200506 200607 200708 200809 200910 LA Groups, Years Welsh Gov't Grant Non-Domestic Rates Council Tax Welsh Gov't Grant Non-Domestic Rates Council Tax
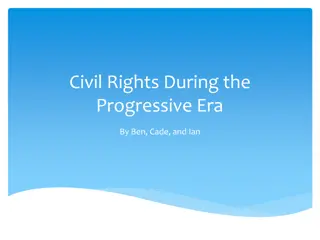
Results and Findings: Movement in Per capita spend by Service Area & Group - Pre-Austerity (2005/06 2009/10) Council Funding and Housing Benefits Cultural and Related Services Local Env'tal Services Service Expenditure Areas Other Rev. Exp. Planning & Economic Dev't Roads and Transport Social Services -30.00% -20.00% -10.00% 0.00% 10.00% 20.00% 30.00% 40.00% 50.00% 60.00% 70.00% Changes in Service Expenditure Wales RoW NEW TSC TV
Results and Findings: Movement in Per capita spend by Service Area & Group - Early Austerity (2010/11 2014/15) Council Funding and Housing Benefits Cultural and Related Services Local Env'tal Services Service Expenditure Areas Other Rev. Exp. Planning & Economic Dev't Roads and Transport Social Services -50.00% -40.00% -30.00% -20.00% -10.00% 0.00% 10.00% 20.00% 30.00% 40.00% Changes in Service Expenditure Wales RoW NEW TSC TV
Results and Findings: Movement in Per capita spend by Service Area & Group - Late Austerity (2015/16 2019/20) Council Funding and Housing Benefits Cultural and Related Services Local Env'tal Services Service Expenditure Areas Other Rev. Exp. Planning & Economic Dev't Roads and Transport Social Services -35.00% -30.00% -25.00% -20.00% -15.00% -10.00% -5.00% 0.00% 5.00% 10.00% 15.00% Changes in Service Expenditure Wales RoW NEW TSC TV
Impacts on Welsh LAs Income and Spending Income Reduction in RSG and increases in CT and NDR Rebalancing of proportions, but RSG still dominates Increases in CT and NDR insufficient to alleviate the need for cuts What is happening to service expenditure? 2005/06-2009/10 - five service areas out of seven moved to the right; two to the left. Note Social Services to the left 2010/11-2014/15 - four services areas moved to the left; three to the right, but increased expenditure to the right more narrowly focused on specific services 2015/16 -2019/20 - Social Services moved to the right, all other services to the left i.e. gradually less and less variation/discretion (dominated by social services and education).
Impacts on Welsh LAs Income and Spending (Contd) How do the 4 regions compare? Surprisingly consistent patterns across all 4 regions, again suggesting a reduction in variation/discretion Social Services was often prioritised over other statutory/non-statutory services the problem child that other services had to bail . Only 2 Blocks had positive movements in the late austerity era Education and Social Services. These are both statutory and demand-led. Non-statutory services were deprioritised. North East Wales LAs had a positive movement in Roads and Transport due to major increases for Flintshire and Wrexham during the late austerity era it is not clear why from the figures.
Financial strategies to withstand the twin pressures The twin pressures increased during the early and late austerity eras. Proactive and anticipatory strategies were adopted to sustain service delivery. The continuous reduction in funding compelled all Welsh LAs to mobilise more resources from council tax than they received from business rates. Unitary Authorities in North East Wales and the Rest of Wales collected more council taxes than non-domestic rates. The Valleys and The Southern Cities received more from business rates than council taxes in the pre-austerity and early austerity eras.
Final thoughts. Is devolution and discretion stopping in Cardiff? Is Wales becoming Barnet? - The Barnet graph of doom from 2010 a PowerPoint slide, showing that within 20 years, unless things change dramatically, Barnett Council will be unable to provide any services except adult social care and children s services. No libraries, no parks, no leisure centres not even bin collections .
References Barbera, C., Jones, M., Korac, S., Saliterer, I. and Steccolini, I., 2017. Governmental financial resilience under austerity in Austria, England and Italy: how do local governments cope with financial shocks? Public Administration 95(3): 670-697. Crawford, R., Joyce, R. and Phillips, D., 2012. Local government expenditure in Wales: recent trends and future pressures. Dollery, B. and Wijeweera, A., 2010. An assessment of rate-pegging in New South Wales local government. Commonwealth Journal of Local Governance, pp.56-76. Downes, J. and Taylor-Collins, E., 2019. At the tipping point? Welsh local government and austerity. June 2019. Ferry, L. and Eckersley, P., 2011. Budgeting and governing for deficit reduction in the UK public sector: act one 'the Comprehensive Spending Review'. The Journal of Finance and Management in Public Services, 10(1), pp.14-23. Ferry, L., Combs, H. and Eckersley, P., 2017. Budgetary stewardship, innovation and working culture: Identifying the missing ingredient in English and Welsh local authorities recipes for austerity management. Financial Accountability & Management, 33(2), pp.220-243. Hay, R. and Martin, S., 2014. Controlling local government spending: the implementation and impact of capping council taxes. Local Government Studies, 40(2), pp.224-239. HM Treasury. 2010. Spending Review 2010. London, HM Treasury. Ifan, G. and Sion, C. 2019. Cut to the bone? An analysis of Local Government finances in Wales, 2009-2010 to 2017-18 and the outlook to 2023-24. Cardiff, Wales Fiscal Analysis. Ogle, Joseph, Daria Luchinskaya, and Michael Trickey. 2017. Austerity and Local Government in Wales: an analysis of income and spending priorities, 2009- 10 to 2016-17. Cardiff: Wales Public Services 2025. Accessed December 02, 2018. Available at: http://www.walespublicservices2025.org.uk/2017/11/23/austerity-and-localgovernment-in-wales-an-analysis-of-income-and-spending-priorities- 2009-10-to-2016-17/


")