Environmental Risk Assessment of Australian Marsupials and Native Rodents

Explore the challenges and solutions in conducting environmental risk assessments for terrestrial vertebrates like marsupials, native rodents, and birds in Australia. Dive into topics such as exposure calculations, toxicity evaluations, and data gaps that influence decision-making processes. Gain insights into the energy requirements and food intake rates of Australian mammals, shedding light on the complexities of ensuring protection for these species.

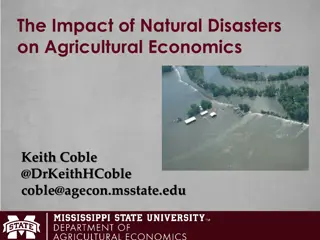
Download Presentation

Please find below an Image/Link to download the presentation.
The content on the website is provided AS IS for your information and personal use only. It may not be sold, licensed, or shared on other websites without obtaining consent from the author. Download presentation by click this link. If you encounter any issues during the download, it is possible that the publisher has removed the file from their server.
E N D
Presentation Transcript
Taming the complexity Use of computer software to efficiently perform tiered environmental risk assessments. Chris Lee-Steere Australian Environment Agency Pty Ltd Tel: 02 6273 7777 chris.leesteere@aeapl.com.au
Not quite sure how to structure this session the initial focus is on terrestrial vertebrate risk assessment and hopefully an informative discussion on the current limitations facing us in the environmental assessment space: Marsupials Native rodents Birds Discussion will focus around: Exposure (allometric equations); Exposure (residues on food items); Calculating a daily dietary dose; Toxicity (data gaps and extrapolation)
Australian mammals marsupials and native rodents Current acknowledgement by the Department of the Environment wrt mammals: generally considered on a case-by-case basis in Australian assessments; This is partially due to the lack of data on Australian species. For example, the US EPA converts the residue concentrations to a daily oral dose based on the fractions of body weight consumed daily as estimated through mammalian allometric relationships. There are no consolidated statistics on Australian mammals available to the Department for such an exercise. Such data ARE available, they just have to be researched and applied! When the Department does consider risk to mammals, they apply an allometric equation from Nagy (1987) which was developed for rodents.
Australian mammals marsupials and native rodents How protective have we actually been? Energy requirements Nagy (1987) rodents and Australian Dasyurids 3.1 3 2.9 2.8 2.7 2.6 2.5 2.4 LOG(FMR) 2.3 2.2 2.1 2 1.9 1.8 1.7 1.6 1.5 1.4 0.8 1.2 1.6 2 2.4 2.8 3.2 LOG(Bodyweight)
Australian mammals marsupials and native rodents How protective have we actually been? Energy requirements and food intake rates: Food intake rates depend on not just the energy needed by the animal, but also by its diet Arthropods have relatively low moisture compared to plant matter; The efficiency of mammals in assimilating energy from arthropods is much higher than that from plant matter; An insectivorous mammal will need to consume much less food than an herbivorous mammal with the same body weight; Overall exposure is also a function of residue levels on the different food items.
Australian mammals marsupials and native rodents How protective have we actually been? Food item Grains (DoTE) Insects (Dasyurids) Grass (Macropods) Body weight of animal 10 g 10 g 1000 g Residue (1 kg ac/ha) 13.4 mg/kg 13.8 mg/kg 214 mg/kg Food intake rate (g/d fw) 2.42 5.2 g 215 FIR/BW 0.24 0.52 0.21 Daily intake (mg/kg bw/d) 3.2 7.2 44.9 This slide provides a good lead into explain why FIR is so different for same bw animals with different diets at 10 g, both should have similar daily energy requirements (this should be shown) and the diff in FIR is due to energy levels in food items and the water content in food items and the AE.
Dietary risk quotients vs dose based risk quotients Scientific limitations of dietary studies; No longer required by Europe (for almost 10 years); Software and applied methodology for Australian native birds and mammals only adopts a dose based risk quotient approach; APVMA still appears to accept dietary risk quotients (these seem to be preferred by the Department of the Environment); They are simply not protective and do not allow for consideration of animals of different body weights and energy requirements from different food items. Example 1000 g ac/ha, LC50 = 1200 mg/kg diet; LD50 = 120 mg/kg bw (T-Rex FIR equations): Dose based risk quotient 20 g bird 2.0 0.90 0.13 0.80 0.21 Residues (mg/kg) 214 98 13.4 84 98 Food item Dietary RQ 100 g bird 1.2 0.53 0.07 0.45 0.12 Short grass Tall grass Fruits Arthropods Seeds* 0.18 0.08 0.01 0.07 0.08 * Based on residues on tall grass (assumes full reproductive component is consumed)
Dietary risk quotients vs dose based risk quotients Or to show the difference in outcomes graphically:
Working on the exposure side of the equation: The estimated daily exposure, that is, the uptake of a compound via a single food item is given by the following equation (EFSA, 2009): Need information on animals energy requirements and dietary requirements. ??? ?? ? ? ? ?? Need information on residue levels in different food items. ??? = In which: ETE = Estimated theoretical exposure [mg/kg bw/d] FIR = Food intake rate of indicator species [g fresh weight /d] bw = Body weight [g] C = Concentration of compound in fresh diet [mg/kg] PT = Fraction of diet obtained in treated area (number between 0 and 1)
Working on the exposure side of the equation: - Food Intake Rate Food intake rates are calculated from the daily energy expenditure (DEE) as follows: The estimates of food intake are based on means of daily energy expenditure for free-ranging animals, energy and moisture content and assimilation efficiencies. The food intake rate (FIR) is calculated as follows (EFSA, 2009): ??? ??? = 1 ?? ?? 100 ?? ? 100 ? Where: DEE = Daily energy expenditure of the indicator species (kJ/d); FE = Food energy (kJ/dry g); MC = Moisture content (%); and AE = Assimilation efficiency (%)
Working on the exposure side of the equation: - Food Intake Rate Daily Energy Expenditure (DEE) BUT a lower energy requirement DOES NOT equate to a lower food intake rate. Energy requirements are met through diet different energy levels, moisture content in different food items, animals assimilate the energy differently.
Working on the exposure side of the equation: - Food Intake Rate The bottom part of the equation (Energy, MC, AE) Energy kJ/g dry Food items Moisture [%] AE, mammals AE, passerines AE, Ducks Grasses and cereal shoots 17.6 76.4 0.47 0.76 0.41 Non-grass herbs 17.8 88.1 0.76 0.76 0.41 Cereal seeds 18.4 14.7 0.84 0.8 0.83 Weed seeds 21.7 9.9 0.84 0.8 0.83 Fruit 14.8 83.9 0.74 0.67 - Arthropods (including caterpillars) 22.7 68.8 0.87 0.76 0.87 Soil invertebrates 19.4 84.3 0.87 0.76 0.87
Working on the exposure side of the equation: - Food Intake Rate The bottom part of the equation (Energy, MC, AE)
Working on the exposure side of the equation: - Residues on food items Pesticide concentrations in animal food items have been estimated with the focus on quantifying possible dietary ingestion of residues on vegetative matter and insects; Traditionally in Australian assessments, residues based on Kenaga nomogram initially developed in 1972 with some improvements adopted later (1996); Residues in the Kenaga data set did not include any measurements on insects; Small and large insect values applied based on data from different plant components; No way to describe what constitutes a small or large insect, or what type of insects different animals will consume; Kenaga data set was updated with additional information from several studies in the EFSA methodology; The updated data set included insect residue data and distinguished between foliar and ground arthropods; PERAMA applies the results from this updated data set and the residue unit dose (RUD) values mg/kg fresh weight from an application rate of 1 kg/ha are as follows:
Working on the exposure side of the equation: - Residues on food items Residues (mg ac/kg fresh weight) for different dietary components based on an application rate of 1000 g ac/ha Residues (mg ac/kg fresh weight), 1000 g ac/ha Acute1 102.3 70.3 87.0 41.1 54.1 13.8 Chronic2 54.2 28.7 40.2 19.5 21.0 7.5 Dietary component Grass + cereals Non-grass weeds Seeds (fruiting period) Fruit3 Foliar arthropods4 Ground arthropods5 1) 90th percentile residue values for acute assessment; 2) Mean residue values for chronic assessment; 3) Based on large fruit from orchards. Further refinement can be made for different fruit types if required; 4) No data are available for canopy dwelling invertebrates in winter or before the leaves appear (interception would be less); 5) Applications on bare soil, or ground directed applications up to principle growth stage 3, ground directed applications in orchards/vines. (PERAMA applies crop interception factors to adjust residues on ground arthropods).
Working on the exposure side of the equation: - Highest exposure scenarios The highest exposure scenarios are found for small insectivorous birds and mammals: Small body weights; high energy requirements food intake rates exceed the bird body weights (relatively high moisture content of food items at ~69%); Herbivorous animals highest residues on food items, high moisture content and lower assimilation efficiencies result in increased food consumption.
Working on the exposure side of the equation: - Highest exposure scenarios The same is observed for mammals: Herbivorous marsupials much larger than herbivorous native rodents; Herbivorous marsupials have a lower energy requirement seen in the FMR/BW equation; Much higher FIR/bw for the small bw rodents greater exposure from the same residue levels on the plant matter food items; Higher exposure same toxicity end-point, therefore higher identified risk.
Australian mammals Example species considered in PERAMA Native rodents: Australian native rodents are essentially omnivorous with the bulk of the diet composed of plant material, mainly seeds or stems and some insect material It is difficult to find species common to the wide range of agricultural regions in Australia. However, it is noted that the diet of many species of living Australian rodents includes insects and seeds. Those species with a small body mass require more nutritious food which is essential to maintain their basal metabolic rate, thus, these species tend to consume seeds since these are more nutritious than most other available foods. Apart from seeds, plant material may consist of shoots/leaves and roots. Fungi are also noted as food sources for several species, but they are not considered within this assessment. Two feeding guilds are considered herbivorous and omnivorous Herbivorous 50% seeds, 25% leaves, 25% roots. No residues modelled for roots so all residues assumed to occur other plant material; Omnivorous 50% seeds, 25% other plant matter, 25% ground insects/arthropods
Australian mammals Example species considered in PERAMA FIR/BW values for foliar applied chemicals for application in assessment of risk to Australian native rodents Body weight Example species Mixed diet FIR/BW Diet component 10 g 50 g Sandy inland mouse Mitchells Hopping Mouse Fawn footed melomys Sandy inland mouse Mitchells Hopping Mouse Fawn footed melomys Bush Rat 1.15 0.73 Seeds (50%) Leaves (25%) Roots (25%) Seeds (50%) Leaves (12.5%) Roots (12.5%) Ground arthropods (25%) 10 g 50 g 0.77 0.48 160 g 0.35 It is understood that the example species are not representative for every growing region or scenario that will be considered. For example, the Bush rat is not found in Tasmania with the swamp rat being the only endemic native Rattus species there. However, at this stage they are thought to be a suitable surrogate for other native rodents that may occur in the different areas.
Australian mammals Example species considered in PERAMA Marsupials: Historically, marsupials have never been considered by themselves in Australian assessments. In terms of smaller ( 600 g) native mammals, in Australia there are 163 species of which marsupials account for 52 (the rest being native rodents and bats). Of the 52 smaller marsupial species in Australia, 46 (88%) can be found in Semi-arid (250 mm to 500 mm rainfall per year) to Mesic (<500 mm rainfall per year) zones with 26 species (50%) only found in mesic zones. Given this, it is reasonable to assume that a significant percentage of marsupial species can occur within agricultural regions in Australia. Russell et al (1989) discuss broadly the different habitats or macroniches occupied by different marsupials; From that analysis, genera from the insectivore/omnivore, herbivore/grazer and herbivore/browser microniche s were focussed on as the most likely exposed through agriculture.
Australian mammals Example species considered in PERAMA Insectivore/omnivore marsupials: 24 genera identified; Field metabolic rate data for 21 species covering 10 genera and two families (Dasyuridae and Peramelidae); Arthropods the principal food items of most dasyurids; Members of Peramelidae family (bandicoots; bilbies) may have significant proportions of plant items in their diet; Insufficient information to develop allometric equations, so insectivorous marsupials are considered at this stage based on the 16 members of the Dasyridae family for which data are available. Herbivores: 10 different Australian genera identified; Field metabolic rate data for 6 species and basal metabolic rate data for an additional 6 species; These data cover 7 genera all from the Macropodidae family; Larger animals (adult weights >1 kg). The smallest marsupial in the metabolic rate data set is the Rufous hare-wallaby (body weight ~1350 g).
Australian mammals Example species considered in PERAMA Food intake rates based on body sizes for Dasyuridae and Macropodid marsupials and example species Dasyurids Body weight (g) 10 40 1000 FIR/BW 0.52 0.35 0.14 Possible indicator species Common planigale Dusky antechinus Quoll Macropods Body weight (g) 1000 4000 10000 FIR/BW 0.21 0.15 0.12 Possible indicator species Small wallaby Pademelon Small kangaroo
Australian birds Example species considered in PERAMA Australian specific information is included with respect to native species. Birds that that NOT been considered at this stage include: Honey eaters (these can be considered on a case-by-case basis in the event of exposure); Shore birds and waders; Seabirds; and Introduced birds. Diets have been analysed for >200 bush birds (passerines) and ~100 water birds (non-passerines). Smallest body weight birds are insectivores; Granivorous birds dominated by parrot species these can also have a mixed diet of seeds and fruits; Limited information on omnivorous diets two mixed diets considered based on historic assessment: Quail diet cereal dominated (70% grains; 30% insects); Mallard diet insect dominated (70% insects; 30% grains). Specialist herbivore birds in Australian agriculture are unlikely to be found; Some species are noted as consuming land plants, for example, Grey Teal, Australian Wood Duck, Tasmanian Native Hen and Plumed Whistling Duck.
Australian birds Example species considered in PERAMA Australian bird body weights, feeding guild and example species Diet Granivore Body weight (g) 15 g 100 g 500 g 7 g 20 g 80 g 10 g 10 g 150 g 400 g Example species Diamond firetail Cockatiel Long billed corella Grey fantail Australian reed warbler Grey crowned babbler Crested shrike-tit Double barred finch Australian ringneck (parrot) Grey teal (only non-passerine) Insectivore Omnivore, insect dominated Omnivore, seed dominated Mixed seeds and fruits Herbivore It is understood that the example species are not representative for every growing region or scenario that will be considered. However, at this stage they are thought to be a suitable surrogate for other birds where data have not been obtained.
Dietary refinements applied in PERAMA 70% seeds / 30% seeds / 100% non-grass weeds 50% fruit 50% seeds Application type 100% foliar insects 100% ground insects 100% short grass 100% seed 100% fruit 30% ground insects Yes/Yes Yes/Yes Yes/Yes Yes/Yes 70% ground insects Yes/Yes Yes/Yes Yes/Yes Yes/Yes Yes Yes Yes Yes Yes Yes Yes Yes Yes Yes Yes Yes Yes Yes Yes Yes No Yes No Yes No/Yes Yes/Yes No/Yes Yes/Yes Yes Yes Yes Yes Dryland Tropical/ subtropical Sugarcane Foliar applied Horticulture - orchards Yes Yes/Yes Yes/Yes Yes Yes Yes Yes Yes Yes/Yes Horticulture - non orchard Yes Yes/Yes Yes/Yes Yes Yes Yes No No/Yes Yes Rights-of-way Yes No Yes No No/Yes Yes/Yes Yes/Yes Yes Yes Dryland Yes No Yes No No/Yes Yes/Yes Yes/Yes Yes Yes Tropical/ subtropical Pre-emergence, bare soil Yes No Yes No No/Yes Yes/Yes Yes/Yes Yes Yes Sugarcane Yes No Yes No No/Yes Yes/Yes Yes/Yes Yes Yes Horticulture - non orchard Yes No Yes No No/Yes Yes/Yes Yes/Yes Yes Yes Rights-of-way Yes No Yes No No/Yes Yes/Yes Yes/Yes Yes Yes Tropical/ subtropical Yes No Yes No No/Yes Yes/Yes Yes/Yes Yes Yes Sugarcane Interfurrow (row) spray Yes No Yes No No/Yes Yes/Yes Yes/Yes Yes Yes Horticulture - orchards Yes No Yes No No/Yes Yes/Yes Yes/Yes Yes Yes Horticulture - non orchard Yes Yes No No Yes Yes No No No/Yes No/Yes Yes/Yes Yes/Yes Yes/Yes Yes/Yes Yes Yes Yes Yes Turf applied Turf Pasture applied Pasture
Toxicity data Mammals o we apply the representative acute oral LD50 result, generally from rats for the acute exposure and the 2- generation reproduction NOAEL again generally from rats for the chronic exposure; o No test results on Australian native species are conducted; o No additional uncertainty factor is applied how representative is a rodent (placental mammal) result to marsupials? Can anyone help with this question? o Should an assessment factor be applied? I expect if it is, there will be many cases where risks are identified and we have no data by which to refine the risk at least on the toxicity side of the equation. Birds o No longer rely on dietary toxicity results, rather, acute oral LD50 from gavage studies at least two species, usually the standard mallard duck (waterfowl species) and bobwhite quail (upland game bird); o Reproduction end-point taken from at least two species, standard being mallard duck and bobwhite quail. o Generally no Australian species, although seeing more data for zebra finch (acute) which is found in Australia
Toxicity data issues and refinement options Acute oral toxicity: o Issues around gavage dosing while the actual dose per bird is quantified (unlike dietary studies), confounding issues such as avoidance or repellency of the chemical are not readily accounted for (dose in reality may be lower); o Gavage gives the dose in one hit while in reality, birds forage continuously receiving a much lower dose but over a longer period of time. o Metabolic process may lower the toxicity compared to those seen from gavage dosing. o Carriers used in administering toxin to birds (corn oil or gelatin) may maximise absorption whereas in reality, toxin may be bound to food items and no longer in the presence of solvent and other components of the formulation (less efficient absorption); o Birds foraging near agricultural areas are likely to ingest a mixture of contaminated and non-contaminated food items throughout a day (reduced exposure argument). o How can an identified risk at the screening level be refined?
Toxicity data issues and refinement options First refinement step can be use of a geometric mean end-point (acute LD50 or chronic NOEC) Still applies the standard assessment factor for inter-species variation 10 in the case of acute data; The geomean can be used with this assessment factor provided the lowest single species result is <1 order of magnitude lower than the geomean; If the most sensitive species result is more than 10 times lower than the geomean, this value should be used but with no further assessment factor; JUSTIFICATION: One issue with undertaking additional ecotoxicity testing on a substance, and applying the lowest available end-point is that as more species are tested, the risk assessment is based on increasingly sensitive species. Consequently, the average level of protection becomes increasingly strict. This position was the subject of scientific debate in the EU and was considered to show that the geometric mean approach would ensure at least the same average level of protection as implied by the relevant EU Directive, and avoid most of the increase in conservatism when additional species are tested. This was based on the assumption that toxicity data were normally distributed on a logarithmic scale.
Toxicity data issues and refinement options A further refinement option is to undertake appropriate field testing time consuming and expensive; The Avian Acute Risk Index approach is a potential answer: Work undertaken by Environment Canada in this field; They demonstrated how field data could be used to derive an empirically based risk index, which by definition, was already validated against real-world outcomes. This approach relied on the logistic models developed in the course of previous analyses of avian field studies in order to derive a likelihood that a given pesticide application will result in observable avian mortality. This index measures the probability that a pesticide application will provide conditions conducive to a bird kill (any compound-related mortality). It makes use of an unbiased measure of pesticide toxicity derived from laboratory acute gavage studies and principles of species-sensitivity distributions and scaling of toxicity to body mass. This toxicity measure and the application rate are used as a joint predictor in a logistic model based on a large sample of agricultural field studies where avian carcass searching was carried out.
Toxicity data Avian Acute Risk Index Imidacloprid Total rate = 1600 g ac/ha (single rate assuming 500 trees/hectare at 3.2 g ac/tree); LD50 = 66 mg/kg (geometric mean, EFSA, 2014); HC5 = 10.6 mg/kg (based on extrapolation factor from combined Bobwhite quail, Japanese quail and mallard duck from Mineau, 2001; 2010).
Case study Insecticide 1 Background: Registrant seeking extension of use of currently approved insecticide into citrus; The use pattern resulted in a relatively significant increase in the current maximum application rate; The decision on the previous assessments for this active were based on the following avian acute toxicity end- points: Bobwhite quail: Mallard duck: LD50 = 128 mg/kg bw LD50 = 84 mg/kg bw Since those registrations, a new avian toxicity study on Zebra finch was undertaken: Zebra finch: LD50 = 5.8 mg/kg bw The assessment was undertaken for the proposed application rate of ~300 g ac/ha Exposure modelling was done using the US EPA T-Rex approach to estimate food intake rates (default values for moisture contents 10% grains, 80% otherwise). Body weights were accounted for by scaling the Zebra finch LD50 to three body weights. The following screening level outcomes were obtained:
Case study Insecticide 1 Body wt (g) Estimated daily exposure (mg/kg bw/d) and Risk Quotients Short grass EDE RQ Arthropods EDE RQ 90th percent residue levels 20 100 Mean residue levels 20 100 6.12 7.80 89.3 50.9 14.6 6.5 35.0 20.0 5.7 2.6 6.12 7.80 31.6 18.0 5.2 2.3 24.2 13.8 4.0 1.8 Residue levels from Kenaga (as applied in T-Rex model); Risk quotient <0.1 to be acceptable (use of lowest LD50 / 10); Conclusion: Unacceptable risks could not be ruled out to small birds; In order to refine the assessment, food consumption rates must be determined for focal species. A reliable source for information could not be identified and no further refinement could be undertaken. The APVMA rejected this application.
Case study Insecticide 1 The APVMA assessor had provided a list of their relevant focal species, but the screening level approach applied here did not allow any revision of the conclusion. The registrant sought advice on how the avian risk assessment could be improved. Refinements focussed on: Revision of the eco-toxicity end-point; Calculation of food intake rates updated to EFSA methodology where better data on moisture contents, energy levels and assimilation efficiencies of different food items were available; Consideration of field data if available, and use of the probability methodology in the Avian Acute Risk Index if required.
Case study Insecticide 1 Revision of the toxicity end-point: The Zebra finch result demonstrates the issue raised in the EU scientific consideration with respect to applying geometric mean results that: The risk assessment is based on increasingly sensitive species when undertaking additional ecotoxicity testing on a substance, and applying the lowest available end-point as more species are tested. The APVMA assessment effectively provided a regulatory level of concern of 0.568 mg/kg when the range of LD50 values measured was 5.68 to 128 mg/kg bw. A geometric mean value was proposed in line with EFSA guidance (and had been applied in the EFSA assessment of this same active constituent): Revised regulatory acceptable level: Geometric mean LD50 for application in the risk assessment Study 1) Mallard duck 2) Bobwhite quail 3) Zebra finch LD50 84 mg ac/kg bw 128 mg ac/kg bw 5.68 mg ac/kg bw Geometric mean Geomean LD50 / 10 = 3.94 mg/kg bw. 39.4 mg/kg bw This value was accepted by the APVMA
Case study Insecticide 1 The focal species identified by the APVMA were then considered in terms of the likelihood of exposure based on their dietary preferences with the following matrix generated: Flowers / blossoms Broadlea f foliage Ground Grasses insects insects Nectar Foliar Pollen Grass seeds Fruit Potential exposure from Citrus application Yes1 Yes Yes1 NO NO Yes Yes No Yes1 Likelihood of individual food item in diet: Scaly breasted lorikeet Musk lorikeet Noisy miner Silvereye Galah Black-faced cuckoo shrike Crimson rosella Eastern rosella Little corella Ringneck Possible High High High High High High High High Possible High High High Possible High High High High High High Possible Possible High Possible Possible Possible High High High High Possible Possible Possible 1) Indirect exposure only once crop interception is taken into account
Case study Insecticide 1 Applying the EFSA method for exposure calculations taking into account the different characteristics of the different food items, and the updated residues, the following risk outcomes were generated: Estimated theoretical exposures (mg/kg bw/d) and corresponding risk quotients. Shaded cells show risk quotients exceeding the level of concern of 1.0 RISK QUOTIENTS ETE (mg/kg bw/d) Ground Ground Foliar Foliar Grass Grass insects insects insects insects seeds seeds Fruit Fruit Scaly breasted lorikeet Musk lorikeet Noisy miner Silvereye Galah Black-faced cuckoo shrike Crimson rosella Eastern rosella Little corella Ringneck 0.5 3.2 0.12 NA NA NA 0.08 0.11 0.11 0.12 0.07 0.10 NA NA NA 3.73 NA 1.62 NA 1.69 NA 1.41 NA NA NA 0.29 NA 0.12 NA 0.13 NA 0.11 0.80 NA NA NA NA 0.73 0.69 0.76 0.44 0.64 Not exposed through diet. 14.7 1.1 0.3 0.4 0.4 0.5 0.3 0.4 6.4 0.5 2.9 2.7 3.0 1.7 2.5 6.6 0.5 5.6 0.4 NA = Not applicable. The food item s do not form part of the APVMA identified focal species diets.
Case study Insecticide 1 Final stage Use of field data and Avian Acute Risk Index: For this particular insecticide, there were no specific field data. However, the Avian Acute Risk Index is generated based on the relationship between avian mortality and the acute toxicity end-point from field studies with a wide range of active constituents. This particular active constituent had been assessed using the Risk Index but for a lower rate. It was re-assessed here for the Geomean derived RAL, and the higher rate: Total rate = 300 g ac/ha; LD50 = 39.4 mg/kg (geometric mean, three values); HC5 = 4.4 mg/kg (based on extrapolation factor from combined Bobwhite quail, Japanese quail and mallard duck from Mineau, 2001; 2010). Acute Avian Risk Score = 0.08 Conclusion: - Avian mortality expected in <1 of every 10 applications. Risk is considered acceptable. Higher tier really only required for one feeding guild the others were acceptable at a lower tier of assessment; Some additional argument on time spent in crop based on radiotracking results from similar species internationally; The APVMA accepted the refined risk assessment and supported registration of the new use.
Case study Insecticide 2 This case study is for an existing chemical which is very data rich in terms of avian toxicity; Large number of use patterns and application rates that can range from 35 g/ha to >1000 g/ha; Acute toxicity data: Results available for 14 species with several results available for several individual species; Range of individual acute oral LD50 values ranged from 5.62 mg/kg bw to 145 mg/kg bw; APVMA assessor did undertake an SSD, but ignored the outcome because several studies were considered supplemental by the US EPA; The preference by that assessor was to apply dietary end-points and undertake the corresponding dietary risk assessment (not scientifically robust); Dietary toxicity data: There were 15 dietary LC50 results available for four different species; The lowest value was an LC50 = 203 ppm diet this was applied in the risk assessment with no consideration of a daily dietary dose, and no consideration of different body weights or diet types. Residues again based on Kenaga and the two traditional mixed diet types were assessed: Quail diet cereal dominated (70% grains; 30% insects); Mallard diet insect dominated (70% insects; 30% grains).
Case study Insecticide 2 This approach essentially ignores residue levels on food items other than insects and grains; The following dietary assessment resulted in risk quotients as follows: Application rates (g ac/ha) Dietary component 35 100 250 500 1000 1500 3000 Q Bird diet A 0.02 0.05 0.13 0.26 0.52 0.77 1.55 Q Bird diet B 0.01 0.02 0.05 0.10 0.19 0.29 0.57 The conclusion from this assessment was: Birds with diet A exceed the LOC (>0.1) at application rates of 250 g ac/ha and higher. Birds with a diet B exceed the LOC at application rates of 1000 g ac/ha and higher. How does the APVMA make a regulatory decision on this approach? no information on the types of birds likely to be impacted. How long would an unacceptable risk be present? not discussed. This is not a robust approach. Dietary assessments like this actually underestimate risk. APVMA sought advice on refinement.
Case study Insecticide 2 The refined approach adopted the more scientifically robust dose based risk assessment in the first instance; The range of acute toxicity data were considered including results considered supplemental by the USPEA; This was justified on the following ground: The reason the data were generally considered supplemental was because they were old and pre-dated established test guidelines; This should not preclude their use if the studies are well reported (which they tended to be); The results found from the older studies were not dissimilar to those found from guideline studies. Two measures of toxicity were established a geometric mean value, and an SSD based on consolidated results for single species (geometric mean for a single species where >1 value was available for that species. The following results were obtained:
Case study Insecticide 2 Geometric mean LD50: n = 15 28.9 mg ac/kg bw/d Acceptable because lowest value <1/10 of geomean RAL = 2.89 mg ac/kg bw/d Species sensitivity distribution HD5: n = 15 9.50 mg ac/kg bw/d RAL = 9.50 mg ac/kg bw/d The SSD HD5 was determined for a higher tier of assessment if required.
Case study Insecticide 2 Maximum supported rates: The avian risk assessment was performed with PERAMA using the range of birds and diets previously described; A maximum rate that could be supported was determined for each bird type and their diet (RQ = 1 based on the geometric mean RAL of 2.89 mg/kg bw/d) Maximum acceptable application rate (g ac/ha) Acute 150 100% fruit 53 15 100% seeds 100 170 500 290 400 100% Non-grass weeds 38 400 100% short grass 51 7 100% foliar arthropods 20 70 80 110 7 100% ground arthropods 20 275 80 435 Bird body weight (g) Diet Chronic Rates of <50 g ac/ha still identified a potential risk. 420 760 1400 2360 345 360 485 685 1070 1360 1910 2995 93 Significantly lower than the dietary approach previously determined (250 g ac/ha). 50 200
Case study Insecticide 2 Refinement options: The active constituent being considered is clearly highly toxic to birds through acute toxicity testing; This is a very data rich chemical, and other information was available from a range of studies including the dietary test data. Several considerations were given to the results of the acute tests compared to what may occur in the field: Doses in the acute oral toxicity studies were administered as one large dose. In the field, most birds continuously feed throughout the day; This active constituent is known to rapidly metabolised by birds to less toxic metabolites. When feeding throughout the day, birds have the opportunity to detoxify and/or eliminate the substance before it accumulates to internal doses that result in lethality; Repeated exposure to the chemical in the diet has been shown to lead to avoidance and in the field birds can switch to sources of non-contaminated food; There can be no avoidance with large single doses administered in gavage studies; For this particular active constituent, there are several field studies available for a range of cropping situations. These were taken into account.
Case study Insecticide 2 Results of field data and comparison with Avian Acute Risk Index: Large range of field studies in different situations (vegetables, citrus, apples, grapes, turf); Wide range of application rates tested under different conditions and formulation types (granules and spray); Telemetry (radiotracking) studies were included in the data set; Generally found that application rates <950 g ac/ha did not result in avian mortalities. Avian Acute Risk Index: This index estimates an HD5 from available data with an extrapolation factor; The extrapolation factor was not required here as the SSD was constructed from a large number of studies and already determines an HD5 The SSD HD5 value of 9.5 mg/kg bw/d was applied; The rate at which avian mortality was predicted from every 10 applications was calculated as 850 g ac/ha; Well supported by the available field data. CONCLUSION: Application rates 850 g ac/ha could be supported.