The Evolution and Challenges of Railways in the Modern World
Railways have played a pivotal role in shaping the world's economy, society, and politics since their revolutionary impact in the 19th century. Despite their initial promise, the rail transport sector faces challenges in adapting and growing to meet the demands of modern integrated logistics solutions. While railways remain a vital part of the global transportation network, they have experienced a decline in both freight and passenger traffic over the past century. The comparison between developed and developing countries highlights disparities in rail network length and usage. The future of railways will rely on strategic reforms and innovations to regain relevance in the evolving transportation landscape.
Download Presentation

Please find below an Image/Link to download the presentation.
The content on the website is provided AS IS for your information and personal use only. It may not be sold, licensed, or shared on other websites without obtaining consent from the author. Download presentation by click this link. If you encounter any issues during the download, it is possible that the publisher has removed the file from their server.
E N D
Presentation Transcript
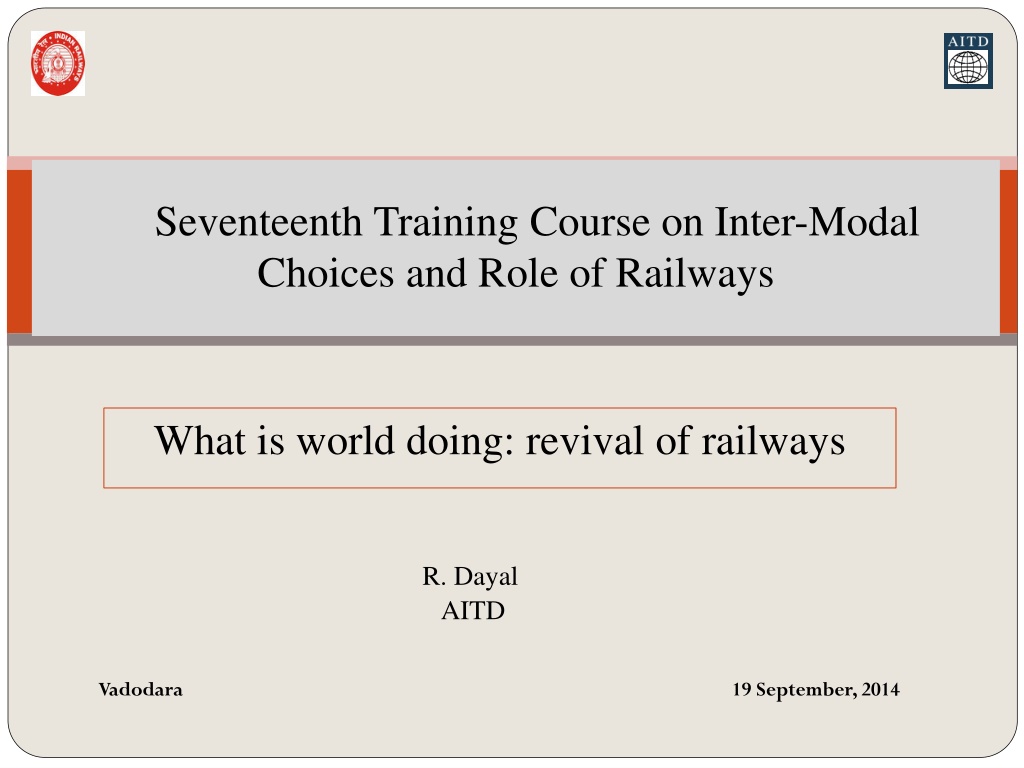
Seventeenth Training Course on Inter-Modal Choices and Role of Railways What is world doing: revival of railways R. Dayal AITD Vadodara 19 September, 2014
Railways changed the world, later lost the plot
Railways changed the world, later lost the plot In 1829, came the rail-road a product truly without precedent. It forever changed economy, society and politics; it rapidly changed the mental geography. The steam engine was to the first industrial revolution what the computer has been to the information revolution. Recent history s most important change-agent, railways over time failed to adapt and grow. Railways can ill afford to remain a mere railway system. It s a transport system. No, it s much more. Its remit is to be an integrated logistics solution provider.
Rail came.. with revolutionary impact Mechanised rail system first appeared in England during 1820s, spread across Europe soon with England alone having 10,433 miles of track in 1860. As the only mode of transport with characteristics of heavy haul over long distances, railways started a promising journey. The share of railways became much more than road in both passenger mobility and freight movement. But soon, road transport outpaced rail transport during the second half of the 20th century.
Rail history.. rise , fall and rise Source: SCI Verkehr Gmbh
Global rail network..a perspective In global terms, the public railway network consists of nearly a million route-km. Compared to population, rail network length per capita in developing countries is only a fifth of that in developed countries. Nearly two-thirds of world s all rail freight is carried in developing countries; over three quarters of that is carried in three countries-China, India and the Russian Federation. Over the latter 20th and now 21st century, rail has seen a gradual decrease in both freight and passenger traffic.
Freight modal split:(%) Year Region/countries OECD North America OECD Europe OECD Pacific China India (2004-05) Latin America Rest of the World Road 40 86 72 25 61 84 87 Rail 60 14 28 75 39 16 13 2005 OECD North America OECD Europe OECD Pacific China India (2031-32) Latin America Rest of the World 48 89 77 46 50 89 91 52 11 23 54 50 11 9 2030 OECD North America OECD Europe OECD Pacific China Latin America Rest of the World 54 90 81 56 92 94 46 10 19 44 8 6 2050 Source: International Transport Forum, Transport Outlook, 2011
Modal share in passenger traffic:(%) Year Region/countries OECD North America OECD Europe OECD Pacific China India (2006-07) Latin America Rest of the World Road 85 76 72 50 87 84 77 Rail 1 5 9 15 13 1 9 Air 14 16 13 9 - 12 6 Other 0 3 6 26 - 3 8 Total 100 100 100 100 100 100 100 2005 OECD North America OECD Europe OECD Pacific China India (2031-32) Latin America Rest of the World 75 66 64 67 97 82 77 1 5 24 26 21 12 - 14 8 0 3 5 12 - 4 9 100 100 100 100 100 100 100 10 9 3 0 6 2030 OECD North America OECD Europe OECD Pacific China Latin America Rest of the World 71 61 57 66 84 82 1 6 11 10 0 4 28 30 28 14 12 7 0 3 4 100 100 100 100 100 100 2050 10 4 7 Source: International Transport Forum, Transport Outlook, 2011
Railways no mere rail mode It needed to play a lead role in transport domain Today, it needs to be an important partner in integrated logistics solution system
Change looms large: dominant characteristics Demographics: Globally, population is still growing; we are living longer. Three billion humans lived on the planet in 1960. In 2050, world population could reach 9 billion. Urbanisation: 70% of world s population will be in cities by 2050. The 40 largest mega regions account for two-thirds of globe s economic activity. New technologies are creating new possibilities. Globalisation: As the world moves closer together, markets get closely interlinked. Manufacturing is globalised, with worldfactories relying on complex global supply chains as their assembly line. Emerging life-styles create more diversity: In emerging economies, 3 billion citizens will join the middle class Digitisation: We have become more mobile than ever before. The mobile society has high expectations from an interconnected transport system. Imperative is it to provide smooth and efficient passenger and goods transport, also safe, affordable, accessible, intermodal and, of course, environment- and climate-friendly.
Global outlook and infrastructure needs Major international gateway and corridor infrastructures such as ports, airports and key rail routes are crucially important for exports and imports of the economies. These infrastructures will assume more importance in the future. Over the longer term, to 2030, significantly high growth is expected in major developing countries. World GDP could possibly double over the period. The strongest growth will be in Asia and between the large emerging economies (China, India), besides Europe and North America. Among the developed country regions, North America s GDP could be 50% higher and Europe s 40% higher, by 2030. GDP per capita levels in China and India could increase three to four times. International passenger and trade demands are likely to see strong long-term growth, leading to rapidly increasing volumes, particularly along major trade and transport corridors between Asia, Europe and North America.
Transport to grow substantially With global GDP doubling by 2030, airline traffic worldwide could grow by around 4.7% per annum, over 2010-30. air freight could increase by around 5.9% p.a.; maritime container traffic could increase by more than 6% p.a.; and rail passenger and freight traffic worldwide could increase, at around 2-3% p.a. On this basis: air passenger traffic could double in 15 years; air freight could triple in 20 years; and port handing of maritime containers worldwide could quadruple, by 2030.
Tectonic economic and logistics shifts Rapidly evolving economic geography Transport growth higher than economic growth Continuing globalisation coupled with growth in population density and GDP impacting the flow of goods and people, altering world s economic geography. Combined E-7 (China, India, Brazil, Russia, Indonesia, Mexico, Turkey) GDP by 2030 will be 30% higher than total G-7 GDP (PwC) Globalisation Falling communication costs results in greater fragmentation of services into components of supplied to final consumers from all over the world. By 2020, 80% of the goods will be manufactured in a country different from where they are consumed compared with 20% now. New division of labour Over 70% of global general cargo volumes are shipped in containers. Containerised trade is likely to continue to growth faster than the world economy Worldwide, transport growth has been consistently higher than economic growth. With growing outsourcing and offshore manufacturing, the containerized cargo market has changed radically. Transport transformation
Supply-chain management : an evolution of logistics As transport costs fall, physical geography matters less. With economies of scale in production, economic geography matters more. Customers have more demanding and diverging requirements With recent increases in the intensity of international trade, the demand for speed has increased. Faster transport can speed the changes in the geography of trade. Firms that specialise in logistics are beginning to blur the lines between transporter, transport arranger, and even manufacturer. 4PL LSPs also provide a host of auxiliary services that become an essential part of the product offering. For example, UPS not only delivers Toshiba laptops throughout the country, but is also responsible for after- sales customer service, for collection of faulty product, and for its eventual return and repair. Logistics services are increasingly being offered by integrated providers. Previously, separate agencies and enterprises would have been responsible for customs clearances, quarantine inspections, freight forwarding, trucking, shipping, and final delivery.
An integrating world Improving connectivity for users hinges on seamless co-operation between the players. The focus is on exploiting comparative advantages and creating synergies with other modes. The individual modes must not compete with each other; they should rather complement each other. The focus is on exploiting comparative advantages and creating synergies with other modes such as code-sharing agreements between airlines and railway companies, or auto manufacturers moving into the car-sharing business. Intermodal transport industry is continuing to evolve and, in so doing, it is becoming increasingly integrated with supply chain management. With the deregulation and privatisation trends, begun in the 1980s in the US, containerisation could spread inland. The shipping lines were among the first to exploit the intermodal opportunities that US deregulation permitted. They could offer door-to-door rates to customers by integrating rail services and local truck pick up and delivery in a seamless network.
A rail resurgence Today, world over there is a rail renaissance
Search for greening of transport Transport must de-carbonise radically to help combat climate change. According to International Energy Agency, global primary oil use would increase between 2009 and 2035, driven by population and economic growth. Overall, transport consumes over 50% of global liquid fossil fuels and is projected to grow by 1.4% per year from 2008 to 2035, to account for 82% of the total projected increment in liquid fuel use. Transport accounts for 62% of world oil consumption, up from 45% in 1970. Forty years after the first oil shock, transport is still 97% dependent on fossil fuels. Energy demand of commercial transportation trucks, aeroplanes, ships and trains will rise by more than 70%, from 2010 to 2040. Under the IEA s 450 Scenario (aimed at restricting CO2 concentrations in the atmosphere to 450 ppm), oil demand in 2035 would be lower than 2009 levels.
Search for greening of transport The transport sector accounts for 13% of all world GHGs, of which 5.5% are related to freight transport. Nearly 25% of global energy-related carbon dioxide (CO2) emissions are transport-related. These are expected to increase by 57% worldwide - 1.7% a year, between 2005 and 2030. Rapid motorisation is driving emissions faster than fuel efficiency. Alternative propulsion technologies can reduce them. By 2050, 3.3 billion cars could be on the planet, a 400% increase on today. Global CO2 emissions from transport could grow by up to 170%, by 2050. Contd .
World oil consumption 1973 2010 Transport (a) Other (b) Industry Non-energy use Transport (a) Other (b) Industry Non-energy use 17% 12% 12% 45% 23% 62% 9% 20%
Energy consumption by rail and road: freight Figure 2: Energy Consumption Ranges in Freight Transport (Megajoules per NTKM) 1.8 1.6 1.4 1.2 1.0 0.8 Road > rail 4-7 times 0.6 0.4 0.2 0 Road Rail Rail Rail (Diesel traction) (Electric traction) (Composite) Source: AITD, Environmental and Social Sustainability of Transport: Comparative Study of Rail and Road
Energy consumption by rail and road: passenger Source: AITD, Environmental and Social Sustainability of Transport: Comparative Study of Rail and Road
World railways: 2012 Average staff strength Total train km: million Freight tonne: million Freight tonne km: million No. of passenger: million Route length: km Passengers km: million S. No. Countries Railways AAR/AMT RAK CR RZD IR Total Brazil UZ KTZ DB AG Total Canada QR BDR - KAI KTM - - PR - SRT DSVN 2 1 3 4 USA China Russia India 2,28,218 66,298 84,249 64,460 1,78,263 20,51,100 8,96,000 13,28,000 856 1,975 1,504 1,022 1,710 2,859 1,440 922 25,24,585 25,18,310 22,22,388 6,25,723 27 9,518 7,95,639 1,44,612 9,78,508 1,522 1,059 7,651 Brazil 29,817 37,720 460 2,67,700 - - 5 6 9 7 0 Ukraine Kazakhstan Germany 21,643 14,319 33,509 278 152 844 457 295 399 2,37,722 2,35,846 1,05,894 485 23 1,966 49,203 18,498 80,210 339000 93,251 2,86,237 12,316 11 - - 4 1,369 8 Canada Austrailia Bangladesh Cambodia Indonesia Malaysia Myanmar Nepal Pakistan Sri Lanka Thailand Vietnam 3000 9,001 27971 - 27000 5454 - - 82424 - 17920 29132 1,829 2835 - 4684 2250.284 - - 7791 - 5327 2347 29 15.4 - 46.41 14.771 - - 30.47 - - 22.716 242 65.6 - 199.337 40.196 - - 64.903 - 44 12.217 59,649 7305 - 20283 3293 - - 20619 - 7504 4558 10 11 12 13 14 15 16 17 18 19 20 2.71 - 20.439 11.828 - - 2.616 - 10.864 6.867 710 - 7166 3071 - - 1757 - 2455 3959 Source: UIC
United States of America Created by the Department of Transportation Act of 1966, US Federal Railroad Administration (FRA) is the regulatory body for railways in the USA. The Staggers Rail Act of 1980 deregulated the American railroad industry to a significant extent, and replaced the regulatory structure that existed since the 1887 Interstate Commerce Act. US railways primarily operate freight traffic. US freight railways are classified into Class I, Class II and Class III railway systems based on operating revenues; Class I railroads those with annual carrier operating revenues of $250 million or more. Class I railroads are BNSF Railway, CSX Transportation, Grand Trunk Corporation, Kansas City Southern Railway, Norfolk Southern Combined Railroad Subsidiaries, Soo Line Corporation, and Union Pacific Railroad. In 2013, operating revenues for Class I railroads were estimated to be $70 billion. United States now planning for high speed rail corridors. The first HSR project envisaged is the California High-Speed Rail network.
Russia The earlier USSR railways administered 32 regional railway systems, 17 of them in Russia. At its peak, Soviet Railways handled half of world s rail freight and a substantial volume of passenger traffic. In 2003, a wholly government owned RZD - Russian Railways, an open joint stock company assumed the responsibilities with railway infrastructure and rolling stock assets transferred to it. Several RZD subsidiaries, in addition to a number of private sector companies, operate freight and passenger services. RZD and its partner companies aim to enable China-Europe container transport by rail to compete with ocean freight. Operating up to 15,000 trains a day, RZD carries around 42% of all freight in Russia, or 85% , if pipelines are excluded. One-third of passenger journeys made by railways - operating an average of 1,580 long distance passenger trains a day, in 2010. The Far East Land Bridge company of RZD and Transcontainer in collaboration with DB Schenker, besides China s CRCT, PKP Cargo, Rail Cargo Austria and other partners ran the first block train from Suzhou in China on 30 September 2013. It aims at a 14 day China-Europe high speed rail freight connection, trains covering about 1,000 km a day. RZD along with companies in Belarus and Kazakhstan created the United Transport and Logistics Company (UTLC) in Astana. The total volume of traffic handled by UTLC is expected to exceed 4 million TEU in seven years. They launched trans-Siberian 7 days project.
European Union An example of an integrated transport planning approach is the European Commission White Paper on transport (adopted in March 2011) It defines a strategy towards competitive and resource-efficient transport systems, setting clear objectives and targets such as: Instigating a 40% use of sustainable low-carbon fuels in aviation. Achieving at least a 40% cut in shipping emissions. This has the overall objective of achieving a total of 60% reduction in CO2 emissions and a comparable reduction in oil dependency. Optimising the performance of multimodal logistics chains. Promoting the use of more energy-efficient modes of transport at large scale facilities by efficient and environmentally friendly freight corridors. Instigating a 50% shift in longer-distance freight journeys from road to other modes.
Track gauges in Asian countries: along TAR Rail Track gauge (mm) Route length (km) S. No Country Bangladesh23, Nepal, India, Pakistan and Sri Lanka Armenia, Azerbaijan, Georgia, Kazakhstan, Kyrgyzstan, Mongolia, Russian Federation, Tajikistan, Turkmenistan, Uzbekistan China, Democratic Republic of Korea, Republic of Korea, Islamic Republic of Iran, Turkey Indonesia Bangladesh, Cambodia, Lao People s Democratic Republic, Malaysia, Myanmar,Singapore, Thailand , Vietnam 1 1,676 16,524 2 1,520 40,707 3 4 1,435 1,067 33,784 4,035 5 1,000 9,882
Distribution of track gauges on TAR 9% 4% 16% 1676mm 1520mm 1435mm 1067mm 32% 1000mm 39%
Missing links on TAR Country Section Gauge (mm) Length (km) Eastern and Western shores of lake Van 1435 99 Turkey Across Bosphorus Strait Karman -Zahedan Jiribam -Tamu Jamuna River Bridge - Joydebpur Tamu-Kalay Thambuzayat-Three Pagoda Pass Lashio-Muse Muse-Dali Three Pagoda Pass - Namtok Poipet Sisophon 1435 1435 1676 4 Iran India 545 180 Bangladesh Myanmar 1676 1000 99 135 1000 1000 1435 110 232 632 China Thailand Cambodia 1000 1000 153 48 Phnom Penh Loc Ninh 1000 254 Laos People s Democratic Republic Nong Khai - Vientiane Loc Ninh Ho Chi Minh city 1000 14 Vietnam 1000 129
TAR northern corridor already off the block, sub-regional southern corridor needs a push TAR northern corridor , although not in reckoning in the initial TAR concept, bristles with immense possibilities of a Eurasian railbridge to grow substantially. There are already several operators vying for the growing pie of intermodal business through TSR route as well as proliferating rail links across Central Asia. The Sinotrans Container Service, Far East Land Bridge, Hupac, DB Schenker Rail Automotive,etc., operate container services, transporting high value, time- sensitive freight, e.g., computers, auto components, FMCG. Achieving transit of 17-20 days for the 11,500 km journey, which in due course can be pared to 8-10 days. Today, rail carries over 1m TEU from East Asia to Europe (UIC), enabling shippers save transit time more than half (20 days by rail vs 50 days by sea). RZD working for the Trans Siberian Seven Day rail transit programme, aiming at a reduction of $ 400 per container. Contd
The UIC-sponsored ICOMOD (Intercontinental Combined Traffic) study, 2011 identified five corridors for the Eurasian railbridge, with an annual potential of $ 2.5-4.5 billion. The Eurasian container market is expected to reach 17.4m TEU in 2020 and 22.7m TEU in 2030. A rail market share of just 5-6% would yield, by 2020, a throughput of about 500,000 TEU annually, or about 20 trains a day. A concerted strategy warrants a determined bid to operationalise the TAR southern corridor. Pending the construction of Kunming-Myanmar, Thailand-Myanmar, Bangladesh-Myanmar, India-Myanmar missing links, Northern corridor can work from near Dhaka to Istanbul/Europe via Zehedan. Trial container trains from Dhaka to Delhi, to Lahore, to Koh-i-Taftan, to Zahedan are indeed overdue. The corridor commands a unique advantage of only one transhipment for break-of-gauge at Zahedan between Dhaka and Istanbul, in fact, Europe. ECO- supported container train runs from Pakistan to Turkey via Zahedan.
China rail: an astounding story of expansion, productivity, and restructuring
China rail: an astounding story o In 1949, CR network aggregated less than 22,000 km o Technologically, CR trailed much behind IR until as late as the 1980s. o in 1990, its 24,800 km core network, with annual density of 30 million gross tonne or more, had largely 50 kg/m and 43 kg/m rails o 55% of wagons were with plain bearings o steam locomotives carried 76% of traffic. o It now has the world s highest traffic density (passenger-km and tonne-km per km of line) o Its output per locomotive, per freight car, per passenger coach is among world s highest. o The combined length of 350 km/h PDLs by 2020 will be over 16,000 route-km; o another 35 mixed traffic lines will enable operation at 200 km/h and higher. o China began to operate network-wide 200 km/h services in April 2007 as part of CR s Sixth Speed Up . Contd
China rail China High Speed Train Heavy Haul Coal Train in China
An abiding reform framework MoR now China Rail Corporation In 2004, a whole tier in CR s management structure, the 44 sub-regional administrations (akin to Divisions on IR), was abolished - leaving RRAs to have a direct line of management to depots, stations and yards. Between 1991 and 2005, MoR provided nearly 90% of the total funds, the remainder coming from local governments and enterprises, many of them state- owned. Since 2005 most new lines are being built as JVs. A number of more substantial JV railway companies came to be established with shareholding by provincial governments and other enterprises. With international freight and logistics companies, MoR established a JV company to develop and operate regional container hubs. China assembled its first domestic steam locomotive in 1952, its first diesel in 1958, its first electric locomotive in 1959. Today, China has developed a domestic supply industry that is successfully competing for export of all rail equipment and technology world over.
IRs share in freight and passenger traffic Trend of Passenger and Freight Traffic on Rail and Road BPKM BTKM Years 1950-51 1970-71 1990-91 2004-05 2011-12 2016-17 2021-22 2026-27 2031-32 Rail 67 118 296 695 1047 1509 2300 3596 5765 Road 31 210 1671 4657 9329 17272 35043 74079 163109 Rail 44 127 247 411 668 982 1669 3011 5363 Road 6 57 283 643 1279 1824 2610 3680 5363 Source: NTDPC
Indias transport in silos Much of the thinking on transport in India has been project-centric, done within single- mode silos One of the major weaknesses of transport infrastructure, for example, in India has been the mismatch at the interfaces of the various modes. The rail-road mix in freight movement has developed rather sub-optimally over the years; railways consistently lost out to roads, unable to install capacity or respond to market needs. A complex web of subsidies, tariffs and taxation policies has characterised transport in India. Inadequate access by rail, road or waterborne transport to existing transfer points can hamper the integration of these modes and transfer between modes. An urgent increase in capacity is required for all modes, and especially that of railways, with an equal focus to last-mile connectivity with ports, logistics parks, etc. While the size of the container ships has substantially increased, the corresponding facilities for evacuation of containers from ports have not kept pace. It is essential to plan in an integrated manner across the entire movement chain.
Railways to assume a new role and also Re-dimension themselves
Big is beautiful, small is no less Railways can ill afford to ignore retail freight market, notwithstanding its core strength lying in wholesale business of dense volumes in full train loads. With an annual freight volume of about 100bt km, half of European cross- border rail freight moves as single wagon load demand; half of all German steel traffic still moves piecemeal as wagon loads, for example. More than 1,000 m.t. of originating freight in India is non-bulk, most of which is transported by road, often over long sub-continental distances. Railways carry a miniscule volume of piecemeal general goods traffic. Rail freight business needs be redimensioned. To create retail railways - to develop wagons with weight and volume capacity 3-4 times that of a truck, also use standardised pallets like airline ULDs, besides road- railers/trailers, product-specific vehicles for value-added logistics. It calls for integrated multimodal transport service. It lends itself to outsourcing , DB Schenker Rail in joint ventures. It necessitates selected nodes/yards/terminals/sidings for aggregation/consolidation. Contd
Big is beautiful, small is no less Assistance by way of common user infrastructure of terminals will help. IR to radically change its approach and incentivise CTOs, for example, in FAK pricing and guaranteed transits for substantial rail retail business to be won over. They may well be valuable partners for IR as secondary retail operators, somewhat like small railways with little of their own infrastructure. It may yield good results with nominated day direction-wise loadings and clearances . Railways is a preferred mode, provided there be a minimum critical mass. Railways need to create this critical mass in partnership with others.
