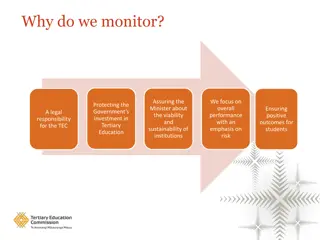
Assessment and Improvement of General Education Outcomes in Psychology
The content highlights the process of identifying and measuring general education outcomes related to global, social, and cultural perspectives in psychology courses. It discusses the importance of assessing students' ability to analyze human behavior from diverse viewpoints and presents a case study showing the effectiveness of such assessments in a Psychology course. The focus is on aligning assessment methods with learning outcomes to improve educational quality.

Uploaded on Oct 03, 2024 | 0 Views
Download Presentation

Please find below an Image/Link to download the presentation.
The content on the website is provided AS IS for your information and personal use only. It may not be sold, licensed, or shared on other websites without obtaining consent from the author. Download presentation by click this link. If you encounter any issues during the download, it is possible that the publisher has removed the file from their server.
E N D
Presentation Transcript
State Assessment Meeting 2013 Psychology s General Education Outcome: Improving Through Assessment
Identifying the Gen Ed Learning Outcome (GELO) Historically: Attain a global social and multicultural perspective (2005) Assigned to Social Science Gen Ed courses: Demonstrate tolerance for a wide range of global, social and cultural points of view (2007)
A Measurable Outcome Describe wide range of global, social and cultural points of view and apply various perspectives to analyze human behavior (2008) Apply the scientific method to analyze human behavior from multiple perspectives and cultural viewpoints
Learning Outcome Report, Fall,2008 Psychology: Introduction to Psychology 312 students Students earned an average grade of 2.89 (85.9% earned a C or better) on a 5 point scaled Assessment on the Assessment of the learning outcome of describe a wide range of global, social and cultural points of view and apply various perspectives to analyze human behavior.
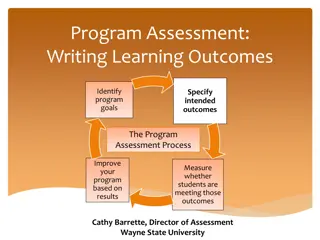
Closing the Loop actionable data! Align Assessment with the Learning Outcome Identify strengths/weakness Come up with a plan of action Assess the effectiveness of the actions taken
Align Assessment with the Learning Outcome From 20 m/c questions assessing course concepts To 20 scenario based m/c questions applying knowledge of perspectives and analyzing behavior
DRAFT PSY2012 Learning Outcomes Fall 2007 Learning Outcomes: Students will: 1. apply the principles of the scientific method to the evaluation of research in the psychological sciences and to material presented in the media about the behavioral sciences. (Q1-4) 2. analyze human behavior in various contexts using the neuroscience, evolution, behavioral genetics, psychodynamic, behavioral, cognitive and socio-cultural perspectives (Q5-8) 3. evaluate human behavior using the various subfields of psychology including neuroscience, sensation, perception, states of consciousness, learning, memory, thinking and intelligence, motivation, personality, psychological disorders (Q9-17) 4. demonstrate a tolerance for a wide range of global, social and cultural points of view. (Q18-20)
Identify strengths/weakness From external blame: Students can t read Advisors let students think psychology is easy Students aren t engaged or accountable
Come up with a plan of action To what action can we take? Adopt a textbook with accessible reading level Recommend sample syllabi available prior to registration Incorporate activities to engage students in learning process with accountable deadlines
Assess Effectiveness of Actions taken Compare year to year GELO (Gen Ed Learning Outcome) assessment data Compare year to year exam scores Compare year to year success rates Examine relationships between newly added activities and exam scores
2011 to 2012 Exam scores Dr. Russell s PSY2012 exam scores year/year Year 2011 2012 N 285 308 Mean 305.58 (76.3%) 49.05 306.07 (76.5%) 46.49 S.D.
Compare Year to Year Success Rate 2011 Overall Success Rate: 175/258 = 68% 2012 Overall Success Rate: 179/243 = 70% 2011 Face to Face Success Rate : 132/173 = 76% 2012 Face to Face Success Rate 116/157 = 74% 2011 Internet Success Rate: 43/85 = 51% 2012 Internet Success Rate: 54/86 = 63%
Examine Relationships Correlations between all 4 exam scores and Interactive quizzing Mastery quizzing r = .34 r = .57 Students who engaged in activities were more likely to earn higher exam grades
Possible hypotheses to explain the data: One semester s data may be insufficient to identify real change Adopting a more accessible text doesn t matter if students don t read (future action: make greater effort to link class material to the textbook). There is a learning curve for faculty adopting new materials and strategies (future action: continue to work at linking online materials to classroom activities and assessment) Students must access and engage in activities in order to see an effect on learning (future action: work to remove barriers to early student access; reinforce student access efforts and contact students who are not using materials to increase access).
The cycle continues: Review of spring data shows continued improvement in internet courses Providing provisional access codes improved student performance on activities, but not overall grades Faculty have voluntarily decided to use common exams, across instructors and formats during, Fall, 2013 term We re still seeking answers .. And strategies for improvement!