Utilizing Integrated Measurements for Reservoir Fluid Characterization while Drilling
This presentation focuses on the integration of surface and downhole measurements to characterize reservoir fluids while drilling. Topics covered include mud gas data acquisition and evaluation, gas analysis while drilling, challenges in tight and abrasive formations, and environmental corrections such as recycling correction, extraction efficiency, dilution factor, and normalization to drilling. The content emphasizes the importance of accurate fluid characterization and offers insights into improving reservoir fluid evaluation in real-time drilling operations.
Download Presentation

Please find below an Image/Link to download the presentation.
The content on the website is provided AS IS for your information and personal use only. It may not be sold, licensed, or shared on other websites without obtaining consent from the author.If you encounter any issues during the download, it is possible that the publisher has removed the file from their server.
You are allowed to download the files provided on this website for personal or commercial use, subject to the condition that they are used lawfully. All files are the property of their respective owners.
The content on the website is provided AS IS for your information and personal use only. It may not be sold, licensed, or shared on other websites without obtaining consent from the author.
E N D
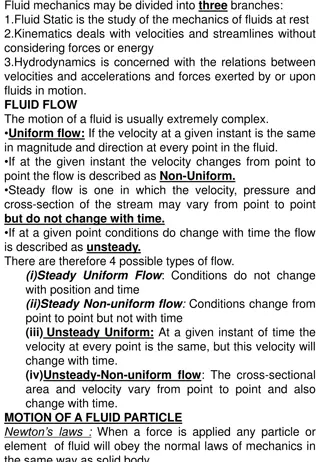
Presentation Transcript
Integrating Surface and Downhole Measurements for Reservoir Fluid Characterization while drilling Maneesh Pisharat Schlumberger
INTRODUCTION Mud gas data acquisition Categories of gas recorded while drilling Corrections applied on measured gas Mud gas system selection Mud gas data analysis Case studies 2
MUD GAS DATA ACQUISITION & EVALUATION Analysis Extraction Interpretation Detection Limit Components Principle Analysis time Efficiency Reliability Repeatability Flexibility Maintenance Data Analysis RT Transfer Integration Evaluation needs: Improve reservoir fluid evaluation while drilling Accurate fluid characterization 3
GAS WHILE DRILLING Liberated gas Produced gas Recycled gas Contamination gas Ref: continental-labs.ab.ca Ref: SPE 65176 4
TIGHT & ABRASIVE FORMATIONS AND ARTIFICIAL HYDROCARBONS Signal Cycle time Signal Cycle time Ref: SPE 125218: Drill bit metamorphism: Recognition and impact on shows evaluation 5
ENVIRONMENTAL CORRECTION: EXTRACTION EFFICIENCY Model Concentration nC7 Corrective Coefficient 2-4 DMC5 2-2 DMC5 3MC52-3 DMC4 nC6 2MC5 2-2 DMC4 nC5 iC5 nC4 iC4 C1 C3 C2 Alkane Time 7
ENVIRONMENTAL CORRECTION: DILUTION FACTOR Quantity of measured hydrocarbon is a function of: Mud volume in the extraction chamber Gas extracted from mud Make up air required for maintaining constant air+gas flow Various extraction systems uses varying amount of (air+gas) and mud flow rate and impact measured hydrocarbon. This is called dilution factor Dilution Factor = Mud Flow / (Gas+air) flow 8
ENVIRONMENTAL CORRECTION: NORMALIZATION TO DRILLING PARAMETERS ??? =?.?? (?? + ?? + ?? + ??? + ???) ??????? ???? ??? ???_????? modified after Wilson, 1976; Whittaker, 1991 9
NORMALIZED GAS VS OIL SATURATION Sw vs NHC plot to identify water, transition and dry oil production intervals Multiple wells ??????= b0+ b1 ????? ??? SPE-197403-MS, Utilization of Mud Logs for Oil Fraction Quantification in Transition Zones and Low Resistivity Reservoirs Described case b0~-0.526, b1~0.19 S~0.034 v/v, R2~0.82, r~0.91 10
SELECTING A MUD GAS SYSTEM Mud type & viscosity Compound No of carbon Formula Boiling point Degasser Efficiency Recycled Hydrocarbon Mud temperature on surface Expected hydrocarbon type & No of compounds Analysis Method Boiling point of Alkanes 11
FROM RESERVOIR TO SURFACE Adsorbed gas Free gas Dissolved gas Monophasic % Flashed gas % Methane 30.95 Methane 48.97 1 2 Ethane 6.42 Ethane 10.05 thermodynamic path from downhole to surface Propane 10.44 Propane 15.88 IsoButane 1.26 IsoButane 1.84 Temperature 1 n-Butane 5.88 n-Butane 8.38 IsoPentane IsoPentane 1.66 2.11 n-Pentane n-Pentane 2.77 3.40 Pressure Hexane+ Hexane+ 40.64 9.38 2 Challenges Fluid type is not only conditioned by the fluid components but also by the reservoir conditions Only the composition of light fluid fraction is accessible to gas measurements 12
MUD GAS DATA INTERPRETATION Surface gas composition is representative of fluid composition at depth Relative abundance of light fractions can indicate fluid type 0. 00 Have you considered requirement for any corrections? C2/ C 0.15 0.15 0. 05 nC4/ C 0.10 0.10 0. 10 0.05 0.05 0. 15 0.00 0.00 0. 15 0. 10 0. 05 0. 00 C3/ C 13
GWD - ANALYSIS Reservoir Non Reservoir Lithologic variations Cap-rock Porous Tight No Yes Organic Matter Leaking or diffusing Sealing HC analysis HC one or many? Many One Mono-reservoir Multi-reservoirs GOC Differentiate the fluids fluid variation depth ? Transition zone OWC Ref: GWD analysis (2001) 14
CASE STUDY: REAL TIME FLUID TYPING ENABLED REPRESENTATIVE SAMPLING Environment Pretest measured formation pressure Resistivity logs Exploration Formation mobility Clastic Hydrocarbon content & fluid ID Challenges Petrophysical Logs WBM Invasion Gas and Oil zones identified Downhole sampling practices were modified Flowed oil in second attempt Results Suggested sampling points Down Hole sampling Ref: SPWLA-56th Annual symposium, THE ESSENTIAL ROLE OF THE ADVANCED SURFACE FLUID LOGGING IN THE RESERVOIR FLUID EVALUATION WORKFLOW PVT analysis Fluid Type C1% C2% C3% iC4% nC4% iC5% nC5% PVT #3 @XX47m OIL 74.93 8.88 7.43 2.14 3.18 1.86 1.58 ASFL @XX47m OIL 75.56 8.99 6.47 2.1 3.21 1.99 1.68 15
CASE STUDY: COMPLEX, MULTILAYERED GAS CONDENSATE FIELD Fluid Facies Log Fluid Legend Environment Appraisal Clastic Vertical Well x040 Fluid 1a 77-81% C1 Fluid 1b 81-84% C1 Fluid 1c 84-88% C1 x100 Star Plot Challenges Complex fluid distribution Identify fluid distribution and contacts C1/C2 x160 C1/C3 C3/C45 x220 Enabled fluid typing with help of historic data Enabled early refinement of reservoir model and optimization of subsequent development program. Results x280 C2/45 C1/C45 x340 Flair Molecular weight vs GOR C2/C3 21.5 21.0 20.5 Ref: Early Identification of Variable Fluid Compositions in Complex, Multilayered Gas Condensate Field Case Study 12-GS-006 Molecular weight, g/mol 20.0 19.5 19.0 0 500 1,000 1,500 2,000 GOR, m3/m3 2,500 3,000 3,500 4,000 16
CASE STUDY: OPTIMIZATION OF WELL PLACEMENT Field calibrated ratios cut offs Environment Development Chalk Horizontal well Mol Wt Triangle method Wh-Bh L/H ratio Aro/Alk OIL/GAS cut off 19 -10 0 5 0.5 Challenges Land the well approximately 5ft TVD below gas-oil contact (GOC) Fluid type inferred based on the analysis of a suite of gas ratios in the C1-C5 and C6+ range. Results Fluid analysis highlighted a compositional grading while approaching the landing point CHARACTERISATION OF FLUID COMPOSITION WHILE DRILLING TO OPTIMISE WELL PLACEMENT, 14th Offshore Mediterranean Conference and Exhibition in Ravenna, Italy, March 27-29, 2019 17
CASE STUDY: OPTIMIZATION OF WELL PLACEMENT A New Approach Fluid profile Gas Previous Well Depth (ft.) Oil Planned Well Length (ft.) Maximizing reservoir contact in the correct phase Place high in oil leg, maintains oil production due to migrating OWC and GOC Advanced Surface Fluid Logging (ASFL) was the key to provide well placement 18
CASE STUDY: OPTIMIZATION OF WELL PLACEMENT Measured signature Modelled signature Lightest Heaviest 19
CASE STUDY: CONTACT MOVEMENT Lithology Drilling Parameters Hydrocarbon contribution Ratios Environment Development Depleted field Gas injection to support pressure Challenges Determine original & current fluid contact Original-GOC Current-GOC Results Fluid analysis indicated original & current contact based on compositional variation 20
CASE STUDY: GOR USING MACHINE LEARNING SPE-195459-MS, A Machine Learning Approach to Predict Gas Oil Ratio Based on Advanced Mud Gas Data 21
SUMMARY Many factors affect mud gas data acquisition - corrections are available for some, but not many others (eg.differential pressure) Select mud gas system appropriate for the challenge Mud gas data normalized for drilling and extraction parameters act as a continuous proxy of fluid evolution. It plays an important role in reducing uncertainties where limited information exists regarding facies & fluid distribution Many formation evaluation workflows integrates mud gas analysis and has found applications in all stages from exploration to field development 22
