Understanding Variability in One-Variable Data Analysis
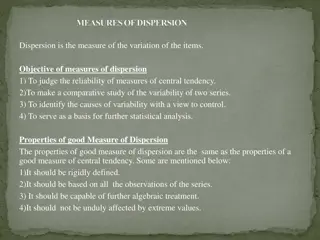
Exploring the concept of variability in statistical analysis of one-variable data, focusing on key measures such as range, interquartile range, and standard deviation. Learn how to interpret and calculate these metrics to understand the spread of data points and identify outliers. Utilize quartiles to analyze data distribution effectively.
Download Presentation

Please find below an Image/Link to download the presentation.
The content on the website is provided AS IS for your information and personal use only. It may not be sold, licensed, or shared on other websites without obtaining consent from the author. Download presentation by click this link. If you encounter any issues during the download, it is possible that the publisher has removed the file from their server.
E N D
Presentation Transcript
Analyzing One-Variable Data Lesson 1.7 Measuring Variability Statistics and Probability with Applications, 3rdEdition Starnes, Tabor Bedford Freeman Worth Publishers
Measuring Variability Learning Targets After this lesson, you should be able to: Find the range of a distribution of quantitative data. Find and interpret the interquartile range. Calculate and interpret the standard deviation. Statistics and Probability with Applications, 3rd Edition 2 2
Measuring Variability Being able to describe the shape and center of a distribution is a great start. However, two distributions can have the same shape and center, but still look quite different. Both distributions are symmetric and single-peaked, with centers around 150. But the variability of these two distributions is quite different. Statistics and Probability with Applications, 3rd Edition 3 3
Measuring Variability There are several ways to measure the variability of a distribution. The three most common are the range, interquartilerange, and standard deviation. Range The range of a distribution is the distance between the minimum value and the maximum value. That is, Range = Maximum - Minimum The range is not a resistant measure of variability. It depends only on the maximum and minimum values, which may be outliers. Statistics and Probability with Applications, 3rd Edition 4 4
An offensive explosion? An offensive explosion? Finding the range Finding the range Problem: During the 2013 NFL regular season, the Denver Broncos had an offensive explosion, setting a new NFL record for total points in a single season up to that time. Over the course of 16 games, the Broncos scored 606 points. The number of points the Broncos scored each game is given below along with a dotplot. 49 41 37 52 51 35 33 45 28 27 31 35 51 20 37 34 Find the range of the distribution. Range = Maximum Minimum = 52 20 = 32 points Statistics and Probability with Applications, 3rd Edition 5 5
Measuring Variability We can avoid the impact of extreme values on our measure of variability by focusing on the middle of the distribution. Order the data values from smallest to largest. Find the quartiles, the values that divide the distribution into four groups of roughly equal size. The first quartile Q1 lies one-quarter of the way up the list. The second quartile is the median, which is halfway up the list. The third quartile Q3lies three-quarters of the way up the list. Statistics and Probability with Applications, 3rd Edition 6 6
Measuring Variability Quartiles The quartiles of a distribution divide the ordered data set into four groups having roughly the same number of values. To find the quartiles, arrange the data values from smallest to largest and find the median. The first quartile Q1is the median of the data values that are to the left of the median in the ordered list. The third quartile Q3is the median of the data values that are to the right of the median in the ordered list. Statistics and Probability with Applications, 3rd Edition 7 7
Measuring Variability The interquartile range (IQR) measures the variability in the middle half of the distribution. Interquartile Range (IQR) The interquartile range (IQR) is the distance between the first and third quartiles of a distribution. In symbols, IQR = Q3 Q1 The quartiles and the interquartile range are resistant because they are not affected by a few extreme values. Statistics and Probability with Applications, 3rd Edition 8 8
How variable is that offense? How variable is that offense? Finding and interpreting the Finding and interpreting the IQR PROBLEM: Here again are the data on the number of points scored by the Denver Broncos in each 2013 regular season game: 49 41 37 52 51 35 33 45 IQR 28 27 31 35 51 20 37 34 Find the interquartile range. Interpret this value in context. First, sort the data values from smallest to largest. Because there is an even number of data values, the median is the average of the two middle values in the ordered list. The first quartile is the median of the 8 values to the left of the median, so it s the average of the two highlighted middle values 31 and 33: Q1 = 32 points. The third quartile is the median of the 8 values to the right of the median. It s the average of the highlighted numbers 45 and 49: Q3 = 47 points. 20 27 28 31 33 34 35 35 37 37 41 45 49 51 51 52 Median = 36 Q3 = 47 Q1 = 32 The interquartile range is IQR = Q3 Q1 = 47 points 32 points = 15 points Interpretation: The range of the middle half of the scores for the Denver Broncos is 15 points. Statistics and Probability with Applications, 3rd Edition 9 9
Measuring Variability If we summarize the center of a distribution with the mean, we should use the standard deviation to describe the variation of data values around the mean. Standard Deviation The standard deviation measures the typical distance of the values in a distribution from the mean. To find the standard deviation sx of a quantitative data set with n values: 1. Find the mean of the distribution. 2. Calculate the deviation of each value from the mean: deviation = value mean 3. Square each of the deviations. 4. Add all the squared deviations, divide by n 1, and take the square root. Statistics and Probability with Applications, 3rd Edition 10 10
How close are your friends? How close are your friends? Calculating and interpreting standard deviation Calculating and interpreting standard deviation PROBLEM:Eleven high school students were asked how many close friends they have. Here are their responses, along with a dotplot: 1 2 2 2 3 3 3 3 4 4 6 Calculate the standard deviation. Interpret this value in context. 1. Find the mean of the distribution. The mean number of close friends for this sample of 11 children is ? = ?? ? =? + ? + ? + ? + ? + ? + ? + ? + ? + ? + ? ?? = ? 2. Calculate the deviation of each value from the mean: deviation = value mean. Value xi Deviation from mean ix 1 2 2 2 3 3 3 3 4 4 6 1 3 = -2 2 3 = -1 2 3 = -1 2 3 = -1 3 3 = 0 3 3 = 0 3 3 = 0 3 3 = 0 4 3 = 1 4 3 = 1 6 3 = 3 x Statistics and Probability with Applications, 3rd Edition 11 11
How close are your friends? How close are your friends? Calculating and interpreting standard deviation Calculating and interpreting standard deviation 3. Square each of the deviations. Value xi Deviation from mean ix Squared deviation ( 1 2 2 2 3 3 3 3 4 4 6 1 3 = -2 2 3 = -1 2 3 = -1 2 3 = -1 3 3 = 0 3 3 = 0 3 3 = 0 3 3 = 0 4 3 = 1 4 3 = 1 6 3 = 3 x ( 2)2 = 4 ( 1)2 = 1 ( 1)2 = 1 ( 1)2 = 1 (0)2 = 0 (0)2 = 0 (0)2 = 0 (0)2 = 0 (1)2 = 1 (1)2 = 1 (3)2 = 9 ) 2 ix x 4. Add all the squared deviations, divide by n 1, and take the square root. ?? ?? ? ? ? + ? + ? + ? + ? + ? + ? + ? + ? + ? + ? ?? ? ?? ?? ?.?? ????? ??????? ??= = = Interpretation: The number of close friends these students have typically varies by about 1.34 close friends from the mean of 3 close friends. Statistics and Probability with Applications, 3rd Edition 12 12
Measuring Variability Properties of the standard deviation as a measure of variability: sx is always greater than or equal to 0. sx = 0 only when there is no variability, that is, when all values in a distribution are the same. Larger values of sx indicate greater variation from the mean of a distribution. sx is not resistant. The use of squared deviations makes sxeven more sensitive than x to extreme values in a distribution. sxmeasures variation about the mean. It should be used only when the mean is chosen as the measure of center. Statistics and Probability with Applications, 3rd Edition 13 13
Measuring Variability Choosing Measures of Center and Variability The median and IQR are usually better than the mean and standard deviation for describing a skewed distribution or a distribution with outliers. Use the mean and sx only for roughly symmetric distributions that don t have outliers. Statistics and Probability with Applications, 3rd Edition 14 14
LESSON APP 1.7 Have we found the beef? Here are data on the amount of fat (in grams) in 12 different McDonald s beef sandwiches, along with a dotplot. The mean fat content for these sandwiches is x-bar = 22.833 grams. 1. Find the range of the distribution. 2. Find the interquartile range. Interpret this value in context. 3. Calculate the standard deviation. Interpret this value in context. 4. The dotplot suggests that the Bacon Clubhouse Burger, with its 40g of fat, is a possible outlier. Recalculate the range, interquartile range, and standard deviation for the other 11 sandwiches. Compare these values with the ones you obtained in Questions 1 through 3. Explain why each result makes sense. Statistics and Probability with Applications, 3rd Edition 15 15
LESSON APP 1.7 Have we found the beef? Statistics and Probability with Applications, 3rd Edition 16 16
LESSON APP 1.7 Have we found the beef? Statistics and Probability with Applications, 3rd Edition 17 17
LESSON APP 1.7 Have we found the beef? Statistics and Probability with Applications, 3rd Edition 18 18
Measuring Variability Learning Targets After this lesson, you should be able to: Find the range of a distribution of quantitative data. Find and interpret the interquartile range. Calculate and interpret the standard deviation. Statistics and Probability with Applications, 3rd Edition 19 19
