Deciphering Climate Variability Through Ocean Buoys Data Collection
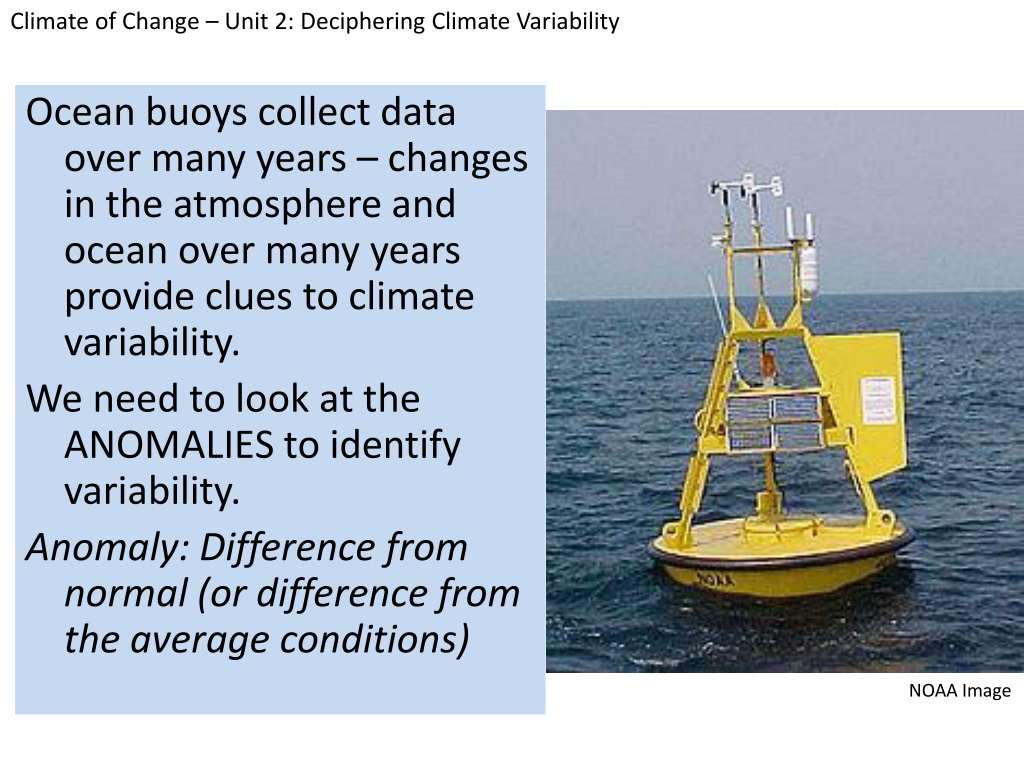


Ocean buoys collect data
over many years – changes
in the atmosphere and
ocean over many years
provide clues to climate
variability.
We need to look at the
ANOMALIES to identify
variability.
Anomaly: Difference from
normal (or difference from
the average conditions)
Climate of Change – Unit 2: Deciphering Climate Variability
NOAA Image


The TAO/TRITON buoys are in an area of the Pacific where there are
few islands or ships to collect weather data. Japan maintains 15 of
the buoys (labeled TRITON below). The other 55 are maintained by
the United States, through the National Data Buoy Center, which is a
division of NOAA.
Climate of Change – Unit 2: Deciphering Climate Variability
NOAA Image
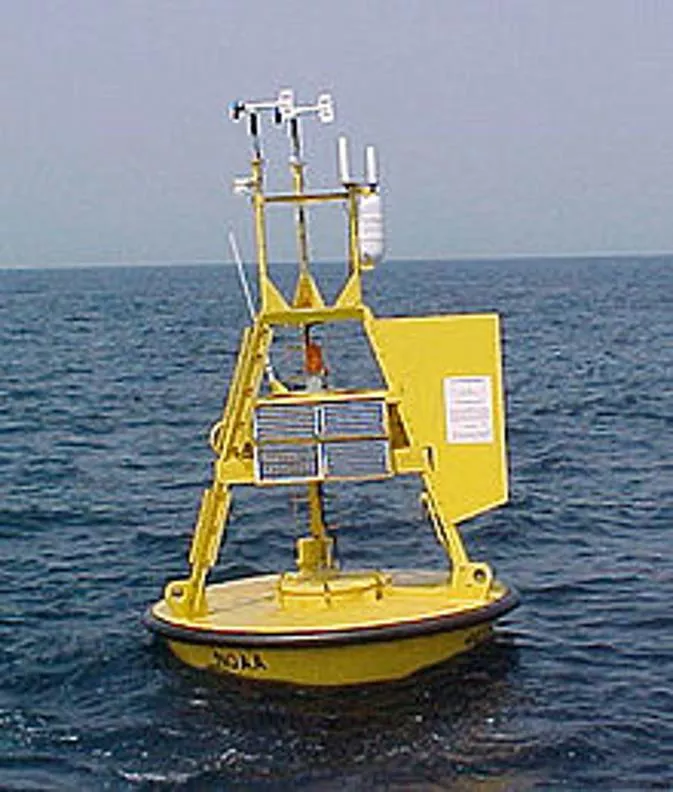
Instruments on the
TAO/TRITON buoys
measure sea-surface
temperature, wind speed
and direction, relative
humidity, air temperature,
and subsurface
temperatures in the upper
500 meters of the ocean.
The buoys are moored in
place with an anchor.
Climate of Change – Unit 2: Deciphering Climate Variability
NOAA Image
Six to eight times a year, scientists and technicians go out on the
NOAA ship Ka’imimoana to repair and replace buoys along
different sections of the array.
Climate of Change – Unit 2: Deciphering Climate Variability
NOAA Image
(Averages)
Arrows depict
wind strength
and direction
(longer arrow
= stronger
wind)
TAO/TRITON Monthly Sea Surface Temp (SST) in °C and Winds (m/s
2
)
Long arrows
indicate wind
is stronger
than average
(and in same
direction)
Short arrows
indicate wind
is similar to
the long-term
average
Climate of Change – Unit 2: Deciphering Climate Variability
About seventy TAO/TRITON buoys collect meteorological data in the equatorial Pacific Ocean between the Galapagos Islands and New Guinea. Scientists retrieve the data in real time via satellite.
Ocean buoys like TAO/TRITON provide valuable data on climate variability by measuring various parameters like sea-surface temperature, wind speed, humidity, and subsurface temperatures. Anomalies from normal conditions help identify patterns over time, aiding in understanding climate changes. Maintained by NOAA and Japan, these buoys play a crucial role in monitoring and studying climate trends. Scientists and technicians regularly maintain and repair these buoys to ensure data accuracy. The data collected offers insights into long-term climate patterns and fluctuations in the Pacific region.

Download Presentation

Please find below an Image/Link to download the presentation.
The content on the website is provided AS IS for your information and personal use only. It may not be sold, licensed, or shared on other websites without obtaining consent from the author. Download presentation by click this link. If you encounter any issues during the download, it is possible that the publisher has removed the file from their server.
E N D
Presentation Transcript
Climate of Change Unit 2: Deciphering Climate Variability Ocean buoys collect data over many years changes in the atmosphere and ocean over many years provide clues to climate variability. We need to look at the ANOMALIES to identify variability. Anomaly: Difference from normal (or difference from the average conditions) NOAA Image
Climate of Change Unit 2: Deciphering Climate Variability NOAA Image The TAO/TRITON buoys are in an area of the Pacific where there are few islands or ships to collect weather data. Japan maintains 15 of the buoys (labeled TRITON below). The other 55 are maintained by the United States, through the National Data Buoy Center, which is a division of NOAA.
Climate of Change Unit 2: Deciphering Climate Variability Instruments on the TAO/TRITON buoys measure sea-surface temperature, wind speed and direction, relative humidity, air temperature, and subsurface temperatures in the upper 500 meters of the ocean. The buoys are moored in place with an anchor. NOAA Image
Climate of Change Unit 2: Deciphering Climate Variability NOAA Image Six to eight times a year, scientists and technicians go out on the NOAA ship Ka imimoana to repair and replace buoys along different sections of the array.
Climate of Change Unit 2: Deciphering Climate Variability TAO/TRITON Monthly Sea Surface Temp (SST) in C and Winds (m/s2) Arrows depict wind strength and direction (longer arrow = stronger wind) (Averages) Short arrows indicate wind is similar to the long-term average Long arrows indicate wind is stronger than average (and in same direction)