Understanding the Impact of Coal Mining on Communities: Briceville Case Study
This task challenges high school students to explore how the availability of natural resources, specifically coal, has affected the Briceville, TN community economically and socially over time. By comparing and evaluating various sources of information, students will communicate the impacts on individuals and society. The task aligns with Tennessee Academic Standards for Science and Next Generation Science Standards, emphasizing the importance of understanding how natural resource availability influences communities and individuals. Through this exploration, students will delve into the economic, social, and environmental implications of resource extraction, prompting critical thinking about the balance between societal needs and environmental protection.
Download Presentation

Please find below an Image/Link to download the presentation.
The content on the website is provided AS IS for your information and personal use only. It may not be sold, licensed, or shared on other websites without obtaining consent from the author. Download presentation by click this link. If you encounter any issues during the download, it is possible that the publisher has removed the file from their server.
E N D
Presentation Transcript
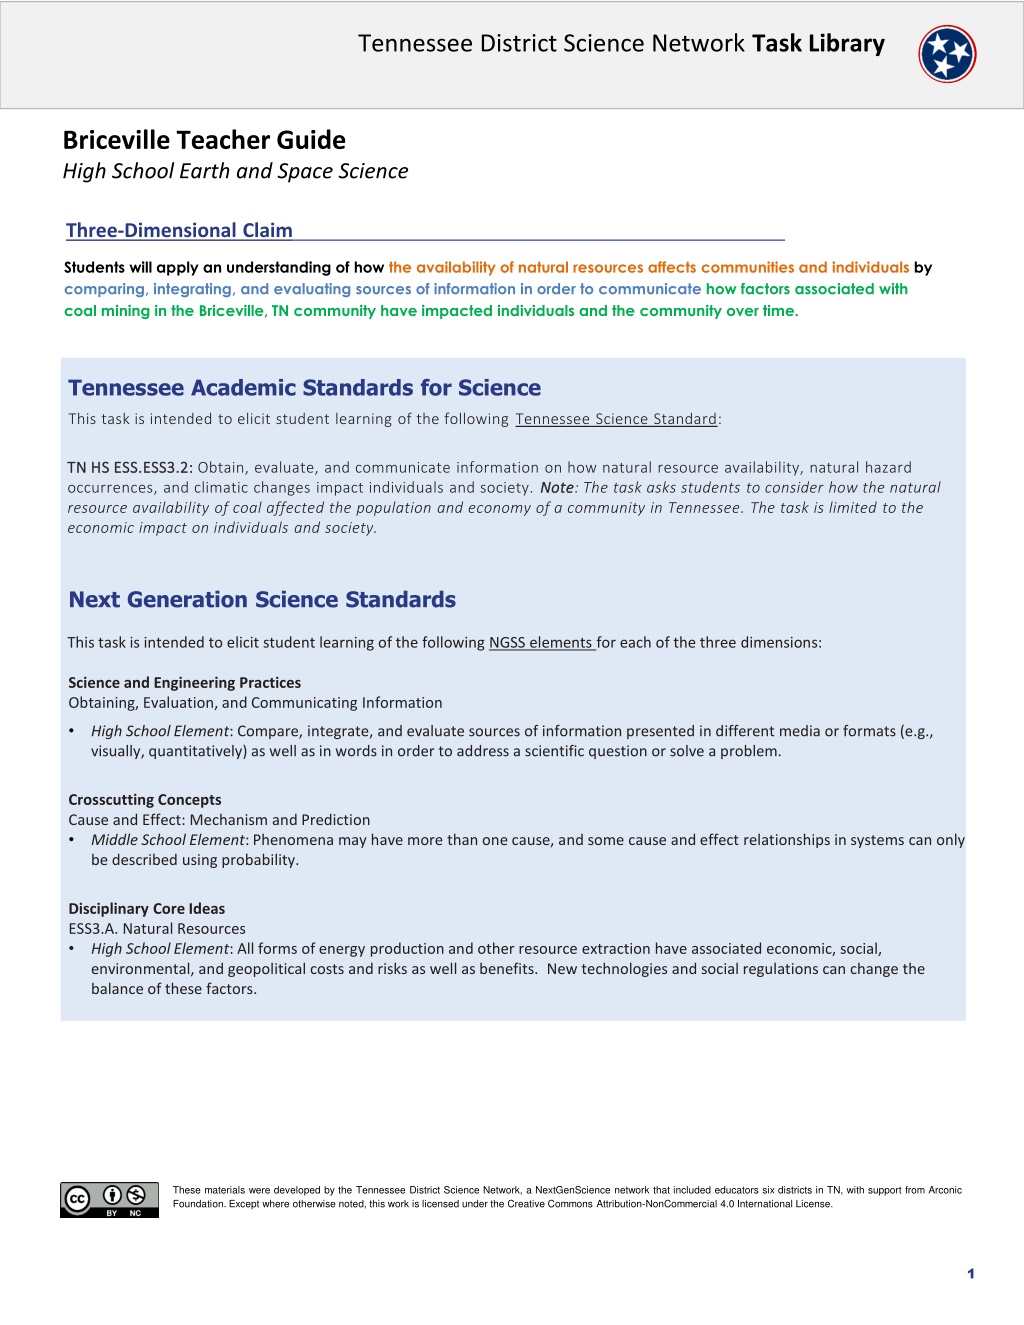
Tennessee District Science Network Task Library Briceville Teacher Guide High School Earth and Space Science Three-Dimensional Claim Students will apply an understanding of how the availability of natural resources affects communities and individuals by comparing, integrating, and evaluating sources of information in order to communicate how factors associated with coal mining in the Briceville, TN community have impacted individuals and the community over time. Tennessee Academic Standards for Science This task is intended to elicit student learning of the following Tennessee Science Standard: TN HS ESS.ESS3.2: TN HS ESS.ESS3.2: Obtain, evaluate, and communicate information on how natural resource availability, natural hazard occurrences, and climatic changes impact individuals and society. Note resource availability of coal affected the population and economy of a community in Tennessee. The task is limited to the economic impact on individuals and society. Note: The task asks students to consider how the natural Next Generation Science Standards This task is intended to elicit student learning of the following NGSS elements for each of the three dimensions: Science and Engineering Practices Obtaining, Evaluation, and Communicating Information High School Element: Compare, integrate, and evaluate sources of information presented in different media or formats (e.g., visually, quantitatively) as well as in words in order to address a scientific question or solve a problem. Crosscutting Concepts Cause and Effect: Mechanism and Prediction Middle School Element: Phenomena may have more than one cause, and some cause and effect relationships in systems can only be described using probability. Disciplinary Core Ideas ESS3.A. Natural Resources High School Element: All forms of energy production and other resource extraction have associated economic, social, environmental, and geopolitical costs and risks as well as benefits. New technologies and social regulations can change the balance of these factors. These materials were developed by the Tennessee District Science Network, a NextGenScience network that included educators six districts in TN, with support from Arconic Foundation. Except where otherwise noted, this work is licensed under the Creative Commons Attribution-NonCommercial 4.0 International License. 1
Tennessee District Science Network Task Library Briceville Teacher Guide High School Earth and Space Science Suggestions for Use This task could be used to introduce a unit on the impact of natural resource availability on communities and citizens. The task is also appropriate as a formative assessment following discussion of renewable and non-renewable resources and the use and impact of fossil fuels on the environment. The interplay of the negative effects of fossil fuel use on the environment and the economic impact on society could lead to robust discussion of how humans must balance society s needs with protection of the Earth itself. Assumptions For students to successfully engage in this task, they should already have a thorough understanding of both renewable and non- renewable resources. In addition, students should be able to explain the use of fossil fuels as an energy resource and the resultant impacts, both positive and negative, on society. Students should be able to graph data showing basic trends and should also be familiar with the use of data as evidence to support a claim. Logistics Intended duration of task: This task takes approximately 60 minutes. Teachers will need to show the Google Slide presentation to set the phenomenon and background information for the task. Teacher notes are included in the Google Slide presentation. Background Briceville, TN is a small community located in Anderson County, TN, whose economy has been primarily dependent on the natural coal deposits located there. A local newspaper article printed in 2014 stated: Briceville lies along Coal Creek, about 20 miles north of the nuclear engineers and supercomputers at Oak Ridge National Laboratory, but a world away. The creek carves out a narrow valley in the hills, trickling past forests that have swallowed up abandoned coal mines. It passes the graves of 32 never-identified miners, killed in an explosion more than a century ago. And it passes small homes that cling to the hillsides in communities like Briceville, where descendants of coal miners still live. Briceville, population about 500, recently lost its only store. There's little anyone can do to stop the exodus of those seeking a paycheck. Teacher Note for Task: This task is one that could very easily veer into the historical context arena, rather than staying focused on the science standard being assessed. Teachers are reminded to assess student answers in terms of science understanding as it relates to impact on society. 2
Tennessee District Science Network Task Library Briceville Teacher Guide High School Earth and Space Science Rubric and Scoring Guidance On the pages that follow, you ll find a scoring rubric and feedback guide for each prompt. After scoring each prompt, the following criteria is designed for numerical grading guidance and can be adapted to fit your grading scales. There are a total of 19 possible points. The rubric is designed as a plus 1 system, whereas students demonstrate levels of mastery towards each question they receive one point for each part of their answers. The following grading criteria is completely optional based upon your classroom grading practices. Grading Criteria 19/19 - 100% 18/19 - 95% 17/19 - 89% 16/19 - 84% 15/19 - 79% 14/19 - 74% 13/19 - 70% 12/19 - 63% 11/19 - 58% Phenomenon/Scenario Students are introduced to a scenario that describes a teenager visiting his great-grandmother in the community of Briceville, TN. The community has very few businesses and the bored teenager is surprised to discover that the community was once a thriving town. Students are shown images of the Briceville, TN community that were taken over 100 years apart. The images show a stark contrast to each other in terms of economic changes that have impacted the community. What happened to cause the changes seen in Briceville? Note: Phenomenon is presented through use of a Google Slide presentation. Teacher notes are included in the slide presentation. Prompt A Describe the relative trend(s) in the population table for the years 1850 - 2019. Explain how the trend stated could have had an economic impact on the community of Briceville. This prompt assesses: SEP Obtaining, evaluating, and communicating information from scientific texts in order to derive meaning, evaluate validity, and integrate information. CCC Phenomena may have more than one cause, and some cause and effect relationships in systems can only be described using probability. 3
Tennessee District Science Network Task Library Briceville Teacher Guide High School Earth and Space Science Prompt A Continued Prompt Scoring Guidance Components of Student Response (SEP, CCC, and/or DCI) Example Responses/Look Fors +1 Student refers to the population table and accurately describes the general trend in population change. (SEP) The population of Briceville increased and then declined. Student includes in the explanation specific details that demonstrate analysis and evaluation of the data. (SEP) The population of Briceville increased from 250 people in 1850 to 6500 people in 1910. However, by 1950, there was a dramatic decline in population to 1700. Almost 75% of the population had left for some reason. By 2019, the population is approaching that of 1850 and has further declined to only 500 people. +1 Student connects the population data to general economic impact on the community. (CCC) The population increased and then significantly decreased as people moved away from the area. Initially there would have been a positive economic impact and then a negative economic impact. +1 Teacher Note: Students might focus in on the end result only that the current population has a negative economic impact. That would still be considered correct. Student connects the population data to economic impact on the community and provides specific examples. (CCC) The population increased and then significantly decreased as people moved away from the area. Initially there would have been a positive economic impact as more goods and services were needed. As the population declined, the businesses that supported those families would not have been needed. +1
Tennessee District Science Network Task Library Briceville Teacher Guide High School Earth and Space Science Prompt A Continued Incomplete Student Response - Example A Score and Score Rationale, if applicable: 0 out of 4 points The student did not indicate a trend of increasing population followed by a trend of decreasing population. +0 points) Student does not provide any evidence of evaluating data such as citing years of peak and low population or stating exact population numbers. (+0 points) The population ended up about the same as it started. Feedback & Next Steps for Students to Make Progress: Encourage student to be as detailed as possible when evaluating data. Be explicit about what the word trend means. Prompt student to begin thinking about the possible causes of the population changes. Incomplete Student Response - Example B Score and Score Rationale, if applicable: 1 out of 4 points - Student does indicate that there is an increasing and decreasing trend to the population in the data table. (+1 point) - Student does not provide any evidence of evaluating data such as citing years of peak and low population or stating exact population numbers. (+0 points) - No evidence of connection to economic impacts. (+0 points) The population went up and then down. Feedback & Next Steps for Students to Make Progress: - Encourage student to be as detailed as possible when evaluating data and to include quantitative data. - Be explicit about what the word trend means. - Prompt student to begin thinking about the possible causes of the population changes. Incomplete Student Response Example C Score and Score Rationale, if applicable: 3 out of 4 points Student does indicate that there is an increasing and decreasing trend to the population in the data table. (+1 point) Student does not provide any evidence of evaluating data such as citing years of peak and low population or stating exact population numbers. (+0 points) Student provides a specific connection and example of how the change in population could have an economic impact on Briceville. (+2 points) The population changed. The table shows that more people moved into the town but then a lot of people must have died or moved away because the population went back down. If that many people left the town, there would not be as many people spending money on food, eating out, or buying clothes. Businesses probably went bankrupt. Feedback & Next Steps for Students to Make Progress: Encourage student to be as detailed as possible when evaluating data and to include quantitative data.
Tennessee District Science Network Task Library Briceville Teacher Guide High School Earth and Space Science Prompt B Students evaluate the information obtained from a map, text, and graph to answer a prompt that asks them to complete a table using data from the text, to describe the trends in surface and underground mining shown in the graph, and to explain how the availability and type of coal could have had an economic impact on Briceville. This prompt assesses: DCI All forms of energy production and other resource extraction have associated economic, social, environmental, and geopolitical costs and risks as well as benefits. New technologies and social regulations can change the balance of these factors. SEP Obtaining, evaluating, and communicating information from scientific texts in order to derive meaning, evaluate validity, and integrate information. CCC Phenomena may have more than one cause, and some cause and effect relationships in systems can only be described using probability. Prompt Scoring Guidance Score Components of Student Response (SEP, CCC, and/or DCI) Example Responses/Look Fors Student correctly completes table and lists one advantage and one disadvantage for each type of mining. (SEP) Surface mining advantages: cheaper, safer, recovers more coal. Surface mining disadvantages: scars the landscape and destroys habitats. Underground mining advantages: does not scar or destroy the surface as much. Underground mining disadvantages: more expensive and more dangerous to the miners. +1 Surface Mining +1 Underground Mining +1 Student correctly uses the graph to determine that the use of surface mining has increased while underground mining has decreased (although with fluctuations). (SEP) The graph shows that from 1920 until 2010, the amount of surface mining has increased. During the same time period, the amount of underground mining decreased. +1 Student correctly explains that the availability and type of coal could have had a negative economic impact on Briceville and Briceville s coal deposits were underground. This would have had a negative economic impact on Briceville. Companies might not have wanted to continue to mine the underground coal due to cost and safety concerns. Since surface mining was cheaper and safer, companies (and miners) might have preferred to work at a surface mine. This would have resulted in fewer jobs and less money to support the businesses in Bricevlle. There would be less need for churches and schools. +1 provides a specific example of economic impact. (DCI, CCC) 6
Tennessee District Science Network Task Library Briceville Teacher Guide High School Earth and Space Science Prompt B Continued Incomplete Student Response - Example A Score and Score Rationale, if applicable: 4 of 5 points - Student correctly completes half the table. (+1 points) - Student correctly uses the graph to state trends about surface vs. underground mining. (+1 points) - Student states there would be a negative impact on the economy of Briceville. (+1 point) - Student states specific outcomes (Examples: job loss, store closures). (+1 point) Student only partially completes the table. The graph shows that the use of surface mining increased while underground mining decreased. Briceville s coal deposit required the use of underground mining. Companies probably decided it was too expensive to keep mining there. That meant that there were fewer jobs available for miners. Without jobs, people either had to leave or just not have money to spend. This would have been bad for the economy because there wouldn t be enough people to keep different stores open. Feedback & Next Steps for Students to Make Progress: - This student needs explicit instruction in analyzing the prompt. Have student underline the important parts of the prompt to develop a mini-checklist of what should be included in the answer. - Ask student to underline the advantages and disadvantages specifically mentioned in the text. Incomplete Student Response - Example B Student correctly completes the table indicating advantages and disadvantages for each type of mining. Score and Score Rationale, if applicable: 2 of 5 points - Student correctly completes the data table. (+2 points) - Student uses the graph to state that surface mining increased but does not additionally state that underground mining decreased. (+0 points) - Student indicates that the economic impact would be positive. (+0 points) - Student does not explain how the type of coal mined in Briceville would have an impact on the economy. (+0 points). The graph shows that more coal was being mined from surface mines. Student circles that the economic impact would be positive. Briceville s coal was underground. Miners probably didn t want to go underground anymore and went to work in surface mines. Feedback & Next Steps for Students to Make Progress: The ability to synthesize information from multiple sources is difficult for many students. This student may benefit from teacher modeling. - This student needs additional help in analyzing the prompt to be sure that all parts of the prompt are addressed. 7
Tennessee District Science Network Task Library Briceville Teacher Guide High School Earth and Space Science Prompt C Students are provided with informational text about the use of coal and natural gas to produce electricity. Students are asked to produce two graphs showing trend relationships based on the information provided. 1. Create a graph to communicate the relationship between the use of coal and the use of natural gas found in the information in the Text 2 bullets above. Include the following on the graph: Use a dashed line (- - - -) to show the overall trend in coal as a primary source of electricity over time. Use a solid line ( - ) to show the overall trend in the supply of natural gas available over time. 2. Create a graph to communicate the relationship between the number of coal-removing machines and the number of employed coal miners as stated in the Text 2 bullets in the information above. Include the following on the graph: Use a dashed line (- - - -) to show the overall trend in the number of employed coal miners in the US used to obtain and produce coal. Use a solid line ( - ) to show the overall trend in the use of machines to obtain and produce coal. Students are also asked to identify two of the items (bullet points) from the informational text table and explain how those factors could have had a negative impact on the economy of Briceville. Select two of the items (bullet points) from the table and explain how those factors could have had an impact on the economy of Briceville. This prompt assesses: DCI All forms of energy production and other resource extraction have associated economic, social, environmental, and geopolitical costs and risks as well as benefits. New technologies and social regulations can change the balance of these factors. SEP Obtaining, evaluating, and communicating information from scientific texts in order to derive meaning, evaluate validity, and integrate information. CCC Phenomena may have more than one cause, and some cause and effect relationships in systems can only be described using probability. 8
Tennessee District Science Network Task Library Briceville Teacher Guide High School Earth and Space Science Prompt C Continued Prompt Scoring Guidance Score Components of Student Response (SEP, CCC, and/or DCI) Example Responses/Look Fors Teacher Note: The goal is for general trends to be displayed correctly in the graph. Students should draw a graph to indicate that the use of coal declined after 1950. The decline does not need to be as significant as shown in this graph, but the graph should show the decline of coal and the increased use of natural gas. The availability of natural gas as a cheaper, cleaner alternative to coal increased in the latter half of the century. The goal is for students to realize that there are multiple causes that impact the effect of natural resources on society. In this case, natural gas was only one of those factors. (SEP) +1 Prompt Scoring Guidance Score Components of Student Response (SEP, CCC, and/or DCI) Example Responses/Look Fors Teacher Note: The goal is for general trends to be displayed correctly in the graph. The goal is for students to understand that multiple causes are usually at play with regard to the impact of natural resources on society. The graph should show an increase in the number of employed miners until around 1950 and then a steady decline after that point. The graph should show that, according to the text, the use of machines in the mining industry gradually replaced the need for as many human miners. (SEP) +1 Incomplete Student Response - Example A Score and Score Rationale, if applicable: 0 of 2 points Student does not show correct trends. Graph 1: Student shows natural gas use declining over time and/or student shows use of coal increasing by end of graph. Feedback & Next Steps for Students to Make Progress: This student should be asked to underline key words from the text that describe the correct trend. Graph 2: Student shows the use of machines declining over time and/or student shows the use of coal miners steadily increasing over time. Example: By the 1950 s coal had become the leading fuel for generating electricity in the United States. The use of coal as a primary source of electricity began to decline after the 1950 s. Note: It is important for students to label the graphs and to use the line formatting indicated. Teachers should not assume that an unlabeled line indicates the correct factor. 9
Tennessee District Science Network Task Library Briceville Teacher Guide High School Earth and Space Science Prompt C Continued Prompt Scoring Guidance Score Components of Student Response (SEP, CCC, and/or DCI) Example Responses/Look Fors Students should be able to identify one point that could have had a positive impact and one point that could have had a negative economic impact. +2 Teacher Note: The bullet points about natural gas are not as strong as the other items in the list. However, the addition of having students graph the information about the use of natural gas against the use of coal should lead them to classify these as potential negative economic impacts. (DCI, CCC) Incomplete Student Response - Example A Score and Score Rationale, if applicable: 1 of 2 points -Student correctly cites one factor and makes a reasonable connection to the negative economic impact in Briceville. (+1 point) Negative Economic Impact: Use of coal as a primary source of electricity began to decline after the 1950 s. Feedback & Next Steps for Students to Make Progress: -Remind the student to read the prompt carefully and underline key words that point to the requirements. This student may have failed to note that the prompt asked for two selections. No positive economic item is listed. Negative Economic Impact: Coal has been used to generate electricity in the United States since 1882. Score and Score Rationale, if applicable: 2 of 2 points -Student cites two factors and classifies them incorrectly. (+0 points). Positive Economic Impact: Coal mine owners began replacing human miners with digging machines and mobile coal loaders. Feedback & Next Steps for Students to Make Progress: -Guide the student toward making the connection between the data and the information given in the initial phenomenon set-up. -Model using one of the data points provided and then ask the student to do the same with two different text points. 10
Tennessee District Science Network Task Library Briceville Teacher Guide High School Earth and Space Science Prompt D What the heck happened to Briceville? What factors have affected Briceville during the past 100 years to cause the changes noted in the photographs? What has been the impact of each factor on the community? Use the information that you evaluated in Parts A, B, and C of this task to develop an explanation for the changes noted in Briceville. This prompt assesses: DCI All forms of energy production and other resource extraction have associated economic, social, environmental, and geopolitical costs and risks as well as benefits. New technologies and social regulations can change the balance of these factors. SEP Obtaining, evaluating, and communicating information from scientific texts in order to derive meaning, evaluate validity, and integrate information. CCC Phenomena may have more than one cause, and some cause and effect relationships in systems can only be described using probability. Prompt Scoring Guidance Score Components of Student Response (SEP, CCC, and/or DCI) Example Responses/Look Fors Student receives 1 point for each piece of evidence that correctly supports the claim. Evidence should be from any of the three prompts included in the task, as the goal is for students to obtain information from the task, evaluate that information as evidence, and then communicate that evidence in support of the claim. (DCI, SEP) -The information in Text 2 states that the use of coal as a primary source of electricity began to decline after the 1950 s. -Based on the information in Text 2, machines replaced many of the things that human miners had been doing. For example, mobile loaders, conveyor belts, and digging machines all replaced the need for actual miners. +3 -Based on the information in Text 1, surface mining was safer and cheaper than underground mining. Briceville s coal required underground mining. 11
Tennessee District Science Network Task Library Briceville Teacher Guide High School Earth and Space Science Prompt D Continued Student receives 1 point for each reasoning that directly explains how the evidence supports the claim. Based on information in Text 2, the use of coal as a primary source of electricity began to decline after the 1950 s. If less coal was needed, then fewer miners were needed to obtain coal. This might have impacted the miners who lived in Briceville. Miners may have lost jobs and moved from the area to seek other employment. As the population of Briceville decreased, the demand for goods and services would also have declined. Businesses, churches, and schools would have been affected by a lack of support. Teacher Note: The task responses support the reasoning aspect of the final prompt. In each part, the student was asked to consider how the evidence would impact the economy of the community. Teachers may need to explicitly point that out to students who need support. (DCI, CCC) Based on the information in Text 2, machines replaced many of the things that human miners had been doing. For example, mobile loaders, conveyor belts, and digging machines all replaced the need for actual miners. As automation of the mining industry increased, fewer human miners were needed. Mining employment would decrease and result in miners (and their families) leaving Briceville to find other job opportunities. This would result in a negative economic impact since there were fewer people to shop at businesses, go to the theater, or spend money in the community. Reasoning for each piece of evidence is noted in blue. +3 Based on the information in Text 1, surface mining was safer and cheaper than underground mining. Briceville s coal deposit required underground mining. Since surface mining was cheaper and safer, miners might have left to work in the safer mines. Coal companies also might have moved operations away from underground mines and toward surface mines. Either way, there would be fewer miners needed to work the underground coal in Briceville, resulting in the negative economic impact seen in the photographs. Teacher Note: The goal is for students to understand that many factors contributed to the economic loss associated with coal mining in the Briceville community. For example: Feedback & Next Steps for Students to Make Progress: Teacher modeling of the first section of Part D may be needed so that students can hear and see the connections being made between the data and the impact on the community. Students could then continue the prompt independently. Some students may still struggle with choosing evidence that supports the claim and may need explicit instruction in selecting evidence that supports the claim of a negative economic impact. - - Increased use of natural gas for production of electricity Increased use of safer, less expensive surface mining (Briceville s coal deposit is underground.) Increased use of machinery to replace human miners - Together, these factors led to the drastic decrease in population noted in the initial data table. Briceville s economy did not recover. The community s buildings, schools, theater, and churches fell into disrepair, as noted in the photographs used in the opening scenario. These materials were developed by the Tennessee District Science Network, a NextGenScience network that included educators six districts in TN, with support from Arconic Foundation. Except where otherwise noted, this work is licensed under the Creative Commons Attribution-NonCommercial 4.0 International License. 12
