Understanding Subsets and Two-way Frequency Tables in Data Science
Introduction to subsets in data analytics, explaining different ways of subsetting data such as row-based, column-based, and data-based subsetting. Additionally, the concept of two-way frequency tables is explored, highlighting how they display observed frequencies for two variables in a structured manner for analysis and interpretation.

Download Presentation

Please find below an Image/Link to download the presentation.
The content on the website is provided AS IS for your information and personal use only. It may not be sold, licensed, or shared on other websites without obtaining consent from the author. Download presentation by click this link. If you encounter any issues during the download, it is possible that the publisher has removed the file from their server.
E N D
Presentation Transcript
Grade X Data Science Version 1.0
Chapter 1: Use of Statistics in Data Science This chapter aims at introducing concept of Subsets and Relative frequency to students. At the end of this chapter students should be able to understand: What are Subsets and relative frequency? Meaning of Mean What is Median and where is it used? What is Mean absolute deviation? What is Standard Deviation?
What is a Subset? Many a times we come across situations where we have a lot of data with us. However, for analysis, we do not need to consider the entire data. Thus, instead of working with the whole data set, we can take certain part of data for our analysis. This smaller set of data that forms a part of a larger set is known as a Subset. For example, if you have a Table of 100 rows and 100 columns and you want to perform certain actions on first 5 rows and first 5 columns, you can separate it out from the main table. This small table of 5 rows and 5 columns is known as a Subset in Data Analytics.
Subsetting is a very significant component of data management and there are several ways that one can subset data. Let us now understand different ways of subsetting the data. Row based Subsetting In this method of subsetting, we take some rows from the top or bottom of the table. Column based Subsetting In this method, we select specific columns from dataset for processing. Data based Subsetting To subset the data based on specific data we use data-based subsetting How do we subset data?
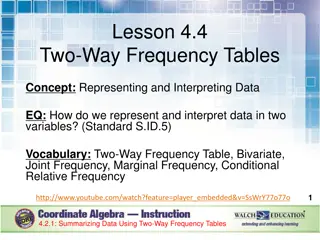
What is a two-way frequency table? A two-way table is a statistical table that demonstrates the observed number or frequency for two variables, the rows indicate one category, and the columns indicate the other category. Two-way frequency tables show how many data points fit in each category. The row category in this example is 5-10 years , 10-15 years and 15-20 years . The column category is their choice Like chocolates or Do not like chocolates . Each cell tells us the number (or frequency) of the people.
Interpreting Two Way Frequency Table In a two-way frequency table, the entries in the table are counts. The table has several features: Categories are in the left column and top row The counts are placed in the center of the table. The totals are at the end of each row and column. A sum of all counts (a total) is placed at the bottom right
Two-way relative frequency table Two-way relative frequency table very similar to the two-way frequency type of table. The only difference here is we consider percentage instead of numbers. Two-way relative frequency tables represent what is the percentage of data points that fit in each category. We can take the help of row relative frequencies or column relative frequencies; it depends on the context of the problem.
What is Mean? Mean is a measure of central tendency. In data science, Mean is nothing but an average value of a data frame. It is a value in the data frame around which entire data is spread out The mean of a data set is calculated by adding up all the values in the data set and later dividing them by the number of values present in the data frame.
Example of Mean Consider that we have a set of 11 numbers 10 to 20 in a data set. Array = {10, 11, 12, 13, 14, 15, 16, 17, 18, 19, 20} So mean is calculated by adding up 10 numbers in the data set. Sum of all the numbers = 165 Mean = 165/10 = 16.5
What is Median? Median is a second measure of central tendency It is a middle value in an ordered data frame To calculate median, we must order our data set in ascending or descending order. The exact middle value of the ordered set is nothing but a Median. If the data set is sorted from smallest value to biggest value, the exact middle value of the set is the Median.
Example of Median Consider the below data set of 5 values. Array = [12, 34, 56, 89, 32] Now let us sort the data set. Sorted array = [12, 32, 34, 56, 89] The value at 3rd position is the middle point of the sorted list. So, 34 is our median for the array.
Mean absolute deviation Mean Absolute Deviation (MAD) is the average of how far away all values in a data set are from the mean. The value of Mean absolute deviation gives a very good understanding of the variability of the data set or in other words how scattered the data set is? One of the applications of Mean Absolute Deviation in real life is when teachers give tests to students and then average the results to see if the average score was high, in between, or too low. Each average tells a story. Absolute Deviation can further help to see the distance between each of the scores and the beginning average scores.
Example of Mean absolute deviation Consider the below data set: Step 1: Calculate the mean Mean = (12 + 16 + 10 + 18 + 11 + 19) / 6 = 14 (rounded off) Step 2: Calculate the distance of each data point from the mean. We need to find the absolute value. For example, if the distance is -2, then we ignore the negative sign. |-2| = 2 Step 3: Calculate the mean of the distances. Mean of distances = (2 + 2 + 4 + 4 + 3 + 5) / 6 = 3.33 So, 3.33 is our mean absolute deviation, and the mean is 14. 12, 16, 10, 18, 11, 19
What is Standard Deviation? The Standard Deviation is a measure of how spread-out numbers are. It is a summary measure of the differences of each observation from the mean. If the differences themselves were added up, the positive would exactly balance the negative and so their sum would be zero.
How to find Standard Deviation? In order to find standard deviation: 1. Calculate the mean by adding up all the data pieces and dividing it by the number of pieces of the data. 2. Subtract mean from every value 3. Square each of the differences 4. Find the average of squared numbers calculated in point number 3 to find the variance. 5. Lastly, find the square root of variance. That is the standard deviation.
Chapter 2: Distributions in Data Science This chapter aims at teaching students what are distributions in data science. By the end of this chapter, students should be able to understand: What is distribution in data science? Different types of continuous distribution Different Types of discrete distribution
Distribution in Data Science Distribution in data science is a method which shows the probable values for a variable and how often they occur. While the concept of probability gives us the mathematical calculations, distributions help us visualize what is happening underneath.
Distributions in Data Science (Contd..) The distribution of an event consists not just the input values that can be seen but made up of all possible values. Every probability distribution is associated with a graph which describes the likelihood of occurrence of each event. Distributions in Data Science are used is many common natural phenomena like heights, blood pressure, measurement error and IQ scores.
Different types of distributions Discrete Distributions A discrete distribution is one in which the data can only take on certain values, for example integers Continuous Distributions A continuous distribution is one in which data can take on any value within a specified range (which may be infinite).
The purpose of Statistical Problem- Solving Processis to collect and analyze data to answer the statistical investigative questions. This investigative process involves four components, each of which involves exploring and addressing variability: Formulate Statistical Investigative Questions Collect/Consider the Data Analyze the Data Interpret the Data Statistical Problem- Solving Process
Chapter 3: Identifying Patterns This chapter aims at teaching students how to identify partiality, preference & prejudice. At the end of this chapter, students should be able to understand: How to identify the partiality, preference and prejudice? What is Central Limit Theorem?
What is partiality, preference and prejudice? We often come across situations where if we have a special fondness towards a particular thing, we tend to be slightly partial towards it. This, in majority cases may affect the outcome or you can say it can deviate the outcome in favor of certain thing. Naturally, it is not the right way of dealing with the data on larger scale. This partiality, preference and prejudice towards a set of data is called as a Bias. In Data Science, bias is a deviation from the expected outcome in the data.
How to identify the partiality, preference and prejudice? Bias is the tendency of a statistics to overestimate or underestimate a parameter. Bias causes your results to sway from the accurate measure and thus, cause sampling errors. Partiality, preference and prejudice in a given data set can be identifying and categorizing them in the appropriate type. We will learn about different types of Bias in the upcoming slide.
Common sources of bias in statistics There are few common sources of bias in data science. These include: Selection bias Selection bias is said to occur when the sample data that is gathered is not representative of the true future population of cases that the model will see. Linearity bias Linearity bias assumes that change in one quantity produces an equal and proportional change in another.
Common sources of bias in statistics Confirmation bias Confirmation Bias or Observer Bias is an outcome of seeing what you want to see in the data. Recall bias Recall Bias is a type of measurement bias. This type of bias occurs when you label similar type of data inconsistently. Survivor bias The survivorship bias is based on the concept that we usually tend to twist the data sets by focusing on successful examples and ignoring the failures. This type of bias also occurs when we are looking at the competitors.
Probability for Statistics Probability is all about counting randomness. It is the basics of how we make predictions in statistics. We can use probability to predict how likely or unlikely particular events may be. We can also, if needed, consider informal predictions beyond the scope of the data which we have analyzed. Probability is a very essential tool in statistics.
Central Limit Theorem In statistics, the larger the sample size, greater is the tendency to be closer to the True possibility. This is called as Central Limit Theorem. The central limit theorem applies to independent, identically distributed variables.
Points to note about Central Limit Theorem Few points to note about the Central Limit Theorem are: The Central Limit Theorem states that the distribution of sample means nears a normal distribution as the sample size gets bigger. Sample sizes that are equal to or greater than 30 are considered enough for the Central Limit Theorem to hold. Key aspect of the Central Limit Theorem is that the average of sample mean, and the standard deviation will always equal the population mean and the standard deviation. A significantly large sample size can predict the characteristics of a population very accurately.
Why is Central Limit Theorem so important? The Central Limit Theorem states that no matter what the distribution of population is, the shape of the sampling distribution will always approach normality as the sample size increases. This is helpful, as any research never knows which mean in the sampling distribution is the same as population mean, however, by selecting many random samples from population, the sample means will cluster together, allowing the researcher to make a good estimate of the population mean. Having said that, as the sample size increases, the error will always decrease.
Chapter 4: Data Merging This chapter aims at helping students understand concept of Data Merging. At the end of this chapter, students should be able to understand: Overview of Data Merging What is a Z-Score? Concept of Percentile, Quartiles and Deciles
Overview of Data Merging In Data Science, data merging is the process of combining two or more data sets into a single data frame. This process is necessary when we have raw data stored in multiple files or data tables, that we want to analyze all in one go.
Overview of Data Merging (Contd..) There are two common examples in which a data analyst will need to merge new cases into one single data file: They have collected data in a longitudinal study (tracker) a project in which an analyst collects data over a period and analyzes it as intervals. They have collected data in a before-and-after project where the analyst collects data before an event, and then again after.
Categories of Data Joins We can perform data merging by implementing data joins on the databases in frame. There are three categories of data joins: One to One Joins In one-to-one join, each row in one table is linked to a single row in another table using a key column. One to Many Joins In a one-to-many join, one record in a table can be related to one or many records in another table. Many to Many Joins A many to many relationships is said to occur when multiple records in one table are related to multiple records of other table.
What is a Z-score? A Z-score describes the position of a point in terms of its distance from the mean when it is measured in the standard deviation units. Z-score is also known as standard score as it allows comparison of scores on different types of variables by standardizing the distribution. A positive z-score tells us that the raw score is higher than the mean average. A negative z-score tells us that the score is below the mean average.
How to calculate a Z-score? The mathematical formula for calculating the z-score is as following: Where, Z = (x- )/ X = raw score = Population mean = Population Standard Deviation Thus, the z-score is the raw score minus the population mean, divided by the population standard deviation.
How to interpret Z-score? The value of a z-score always tells us how many standard deviations we are away from the mean. For example, if the z-score is equal to 0, it is on the mean. A positive z-score tells us that the raw score is higher than the mean average. For example, if the z-score is equal to +2, it is 2 standard deviations above the mean. A negative z-score tells us that the score is below the mean average. For example, if a z-score is equal to -3, it is 3 standard deviations below the mean.
Why z-score is so important? It is very helpful to standardize the values of a normal distribution by converting them into z-score because: It gives us an opportunity to calculate the probability of a value occurring within a normal distribution. Z-score allows us to compare two values that are from the different samples.
Percentiles The maximum value of the distribution can be considered in an alternative way. We can represent it as a value in a set of data having 100% of the observations at or below it. When we consider the maximum value this way, it is called the 100th percentile. A percentile can be defined as the percentage of the total ordered observations at or below it. Therefore, pth percentile of a distribution is the value such that p percentage of the ordered observation falls at or below it.
Quartiles Quartiles of dataset partitions the data into four equal parts, with one-fourth of the data values in each part. The total of 100% is divided into four equal parts: 25%, 50%, 75% & 100%. Using the values of the quartiles, we can also find out the interquartile range. An interquartile range can be defined as the measure of middle 50% of the values when ordered from lowest to highest.
Deciles While quartiles sort the data into four quarters, deciles sort the data into ten equal parts: the 10th, 20th, 30th, 40th, 50th, 60th, 70th, 80th, 90th,100th. The higher the place in the decile ranking, the higher is the overall ranking. For example, a person receiving 99 percentiles in a test would be placed in a decile ranking of 10. However, a person receiving 5 percentiles in the same test would be placed in a decile ranking of 1.
Chapter 5: Ethics in Data Science At the end of this chapter, students should be able to understand about ethics in data science Students will get to know various guidelines that need to be followed around data analysis They will understand points that need to be kept in mind while working with confidential data
Note about data governance framework The data governance framework aims at creating methods, set of responsibilities and processes to standardize, integrate, protect and store data. Data analytics raises many ethical issues, especially when anyone starts making money from their data externally for the purposes different from the ones for which the data was initially collected. To protect ourselves from the trouble, it is important to understand the ethical guidelines around data analysis
Ethical guidelines around data analysis While there are no specific rules for ethical guidelines around data analysis, below are the principles which experts agree upon: Protect Your Customer The private information that is shared should always be handled with confidentiality Customers should always have a clear view of how their data is getting used or traded and should have the authority to manage the flow of their confidential information across enormous, third-party systems. Data should never interfere with human will Data should never institutionalize unfair biases like sexism or racism.
Discarding Confidential Data Once we are done with the user data, especially confidential data, it is important that we discard this data in appropriate way to make sure that it is not accessed by any unauthorized person, and it is not misused in anyway. Digital Data can be safely discarded by formatting the hard drive in which the data was stored or permanently deleting the files. To discard physical data, we can use techniques like shredding, cutting or burning the files to make sure that the sensitive information is safely discarded.


")


")