Understanding Residual Plots in Least Squares Regression Analysis
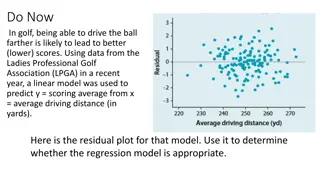
In this lesson, you will explore residual plots to assess the fit of a Least Squares Regression Line (LSRL) to data. From analyzing dry ice evaporation to predicting avocado farm numbers, you'll gain insights into determining model appropriateness and interpreting residual plots. Additionally, you'll delve into the concept of random scatter in residual plots and its significance. Document your learning in a learning log entry for comprehensive understanding.
Download Presentation

Please find below an Image/Link to download the presentation.
The content on the website is provided AS IS for your information and personal use only. It may not be sold, licensed, or shared on other websites without obtaining consent from the author. Download presentation by click this link. If you encounter any issues during the download, it is possible that the publisher has removed the file from their server.
E N D
Presentation Transcript
Day 2 In this lesson, you will create residual plots to help you visually determine how well a LSRL fits the data.
6-51. Dry ice (frozen carbon dioxide) evaporates at room temperature. Giulia s father uses dry ice to keep the glasses in the restaurant cold. Since dry ice evaporates in the restaurant cooler, Giulia was curious how long a piece of dry ice would last. She collected the following data: A. Sketch the scatterplot and LSRL of this data. B. Use your calculator to make a residual plot to determine if a linear model is appropriate. Make a conjecture about what the residual plot tells you about the shape of the original data Giulia collected.
6-52. A study by one states Agricultural Commission plotted the number of avocado farms in each county against that county s population (in thousands). The LSRL is f = 9.37 + 3.96p where f is the number of avocado farms and p is the population in thousands. The residual plot is shown at right a) Do you think a linear model is appropriate? Why or why not? b) What is the predicted number of avocado farms for the county with a population of 62,900 people? c) Using the residual plot, estimate the actual number of avocado farms in the county with 62,900 residents.
6-53. Sophie and Lindsey were discussing what it meant for a residual plot to have random scatter. Sophie said that the points need to be evenly scattered over the whole plot. Lindsey heard her dad say that stars in the night sky can be considered to be randomly distributed even though the stars sometimes appear in clusters and sometimes there are large expanses of nothing in the sky. Your teacher will show you how to make a scatterplot with random points on it. Share your random plot with your teammates. Then make another random scatterplot or two so that you observe several different random scatterplots. Write a note to Sophie and Lindsey telling them what you discovered about random scatter plots.
6-54. LEARNING LOG What is the purpose of a residual plot? How do you interpret a residual plot? Answer this question in your Learning Log using complete sentences and give examples. Describe how to create a residual plot. Title this entry Residual Plots and label it with today s date.
Least Squares Regression Line There are two reasons for modeling scattered data with a best-fit line. One is so that the trend in the data can easily be described to others without giving them a list of all the data points. The other is so that predictions can be made about points for which we do not have actual data. A unique best-fit line for data can be found by determining the line that makes the residuals, and hence the square of the residuals, as small as possible. We call this line the least squares regression line and abbreviate it LSRL. A calculator can find the LSRL quickly. Statisticians prefer the LSRL to some other best-fit lines because there is one unique LSRL for any set of data. All statisticians, therefore, come up with exactly the same best-fit line and can use it to make similar descriptions of, and predictions from, the scattered data.


