Understanding OMPS: Ozone Mapping Profiler Suite and its Applications
OMPS is a vital tool for monitoring global ozone levels, offering precise measurements through its mapper, profiler, and limb profiler components. This advanced suite builds on decades of ozone monitoring heritage, providing valuable insights for researchers and policymakers. By comparing with existing instruments and extending the capabilities of current satellites, OMPS plays a crucial role in assessing and safeguarding the health of the ozone layer.
Download Presentation

Please find below an Image/Link to download the presentation.
The content on the website is provided AS IS for your information and personal use only. It may not be sold, licensed, or shared on other websites without obtaining consent from the author. Download presentation by click this link. If you encounter any issues during the download, it is possible that the publisher has removed the file from their server.
E N D
Presentation Transcript
OMPS Products Applications Craig Long NOAA/NWS/NCEP Climate Prediction Center SUOMI NPP SDR Product Review -- 23/24 October 2012 -- NCWCP Auditorium
What is OMPS OMPS Ozone Mapper Profiler Suite Measures backscattered Ultraviolet and visible radiation a nadir mapper that will map global ozone with about 50-km ground- resolution a nadir profiler that will measure the vertical distribution of ozone in the stratosphere a limb profiler that will measure ozone in the lower stratosphere and troposphere with high vertical resolution Continues more than 30 years of operational ozone monitoring Heritage Profiler - SBUV(/2) Mapper - TOMS, EPTOMS, OMI Limb Profiler Shuttle Ozone Limb Sounding Experiment/ Limb Ozone Retrieval Experiment (SOLSE/LORE) Observations are used by ozone-assessment researchers and policy makers to track the health of the ozone layer. SUOMI NPP SDR Product Review -- 23/24 October 2012 -- NCWCP Auditorium
Comparisons with Current Instruments OMPS vs SBUV(/2) 250x250 km (max) vs 200x200 km scene area ~110 obs per orbit 8 km vs 7-10 km OMPS vs TOMS/OMI 50x50 km (nadir) vs 50x50 km (TOMS) and 13x25 km (OMI) Full Earth coverage OMPS Limb Profile vs SBUV/2 3 km vs 7-10 km 60km down to cloud top 3 views x 200 km x 50 km scene area SUOMI NPP SDR Product Review -- 23/24 October 2012 -- NCWCP Auditorium
Nadir Profiler Data Coverage SUOMI NPP SDR Product Review -- 23/24 October 2012 -- NCWCP Auditorium
Extension of Current Instruments Current Profiler - SBUV/2 NOAA-16: launched 2000 Originally a pm satellite. Now completely precessed a morning satellite NOAA-17: Launched 2002 AM satellite Eq crossing time is adverse for ozone monitoring NOAA-18: Launched 2005 PM satellite Eq crossing time is slipping to later times NOAA-19: Launched 2009 PM satellite Eq crossing time is near earliest. Current Mapper Aura OMI Launched 2004 64 scan positions only positions 1-27 usable SUOMI NPP SDR Product Review -- 23/24 October 2012 -- NCWCP Auditorium
Extension of Current Instruments SUOMI NPP SDR Product Review -- 23/24 October 2012 -- NCWCP Auditorium
How are Ozone Observations Used Monitoring Short term: daily monitoring of ozone hole Long term: monitoring of trends (depletion/recovery) Numerical Weather Models Used for better retrieval of temperature information from IR channels Needed for proper radiation computations Forecasts used for UV Index and boundary conditions for Air Quality models. Reanalyses Use best available reprocessed ozone information Used to validate or used as input for Climate-Chemistry Models SUOMI NPP SDR Product Review -- 23/24 October 2012 -- NCWCP Auditorium
Analyses and Derived Products SH ozone hole analysis NH 2011 low ozone analysis Ozone hole time series plot Ozone anomalies time series Global ozone time series trends UV Index US & Global Air Quality forecasts, boundary conditions & stratospheric intrusions SUOMI NPP SDR Product Review -- 23/24 October 2012 -- NCWCP Auditorium
Ozone Hole Monitoring SUOMI NPP SDR Product Review -- 23/24 October 2012 -- NCWCP Auditorium
Ozone Hole Monitoring Current SH Total Ozone Analysis from SBUV/2 obs March 30, 2011 NH Total Ozone Analysis from SBUV/2 obs SUOMI NPP SDR Product Review -- 23/24 October 2012 -- NCWCP Auditorium
GFS Ozone Products 5 hPa 10 hPa 20 hPa 30 hPa 50 hPa 70 hPa Current GFS Total and O3MR Ozone Analyses SUOMI NPP SDR Product Review -- 23/24 October 2012 -- NCWCP Auditorium
Long Term Monitoring SUOMI NPP SDR Product Review -- 23/24 October 2012 -- NCWCP Auditorium
Ozone Anomalies SUOMI NPP SDR Product Review -- 23/24 October 2012 -- NCWCP Auditorium
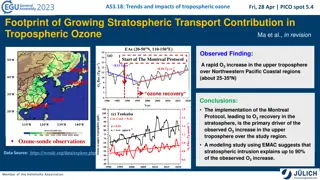
Ozone Trends Statistical analysis of time series can be performed once atmospheric and solar oscillations and volcanic aerosols have been removed. Inflection point determined to be 1997. SUOMI NPP SDR Product Review -- 23/24 October 2012 -- NCWCP Auditorium
UV Index Forecasts UV Index fcst utilizes: - Solar position - Elevation - Total ozone fcst - Albedo fcst - Cloud fcst - Aerosol fcst SUOMI NPP SDR Product Review -- 23/24 October 2012 -- NCWCP Auditorium
UV Index Forecasts High UV Index due to Low Ozone values in ozone hole. SUOMI NPP SDR Product Review -- 23/24 October 2012 -- NCWCP Auditorium
Benefits of Limb Sounder Higher Resolution With High res obs Higher vertical resolution obs than SBUV will enable air quality forecasters to monitor stratospheric intrusions. SBUV/2 alone SUOMI NPP SDR Product Review -- 23/24 October 2012 -- NCWCP Auditorium
Fini SUOMI NPP SDR Product Review -- 23/24 October 2012 -- NCWCP Auditorium
