Understanding Molecular Flow in Vacuum Systems
Molecular flow in vacuum systems occurs at low pressures where particles move independently, interacting mainly with the vessel's geometry. Tools like MolFlow+ and simulations help analyze pressure profiles and validate system designs. Geometry, outgassing, and pumping speeds are critical factors impacting pressure distributions. FRIB Front End simulations using MolFlow+ verify design requirements for different beam scenarios like uranium and argon beams with oxygen support gas.
Download Presentation

Please find below an Image/Link to download the presentation.
The content on the website is provided AS IS for your information and personal use only. It may not be sold, licensed, or shared on other websites without obtaining consent from the author. Download presentation by click this link. If you encounter any issues during the download, it is possible that the publisher has removed the file from their server.
E N D
Presentation Transcript
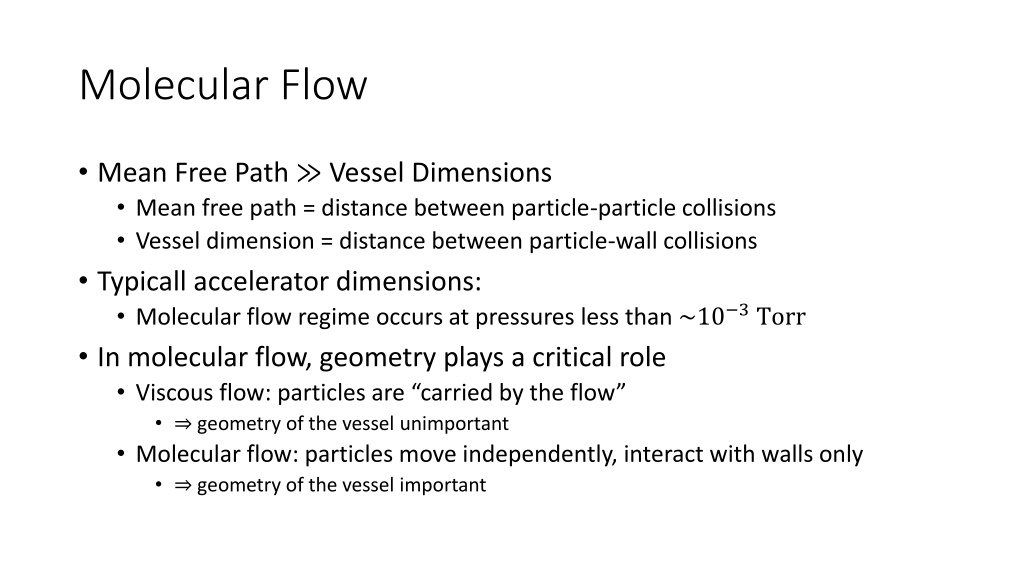
Molecular Flow Mean Free Path Vessel Dimensions Mean free path = distance between particle-particle collisions Vessel dimension = distance between particle-wall collisions Typicall accelerator dimensions: Molecular flow regime occurs at pressures less than ~10 3Torr In molecular flow, geometry plays a critical role Viscous flow: particles are carried by the flow geometry of the vessel unimportant Molecular flow: particles move independently, interact with walls only geometry of the vessel important
Molecular Flow Simulations Particles bounce off walls Random direction No memory of momentum before the interaction Outgoing probability distribution governed by Lambert s Cosine Law Pressure obtained from particle hit counts over a given surface Particles bouncing off the dipole electrodes and chamber walls in the vertical drop dipole in FRIB Front End
MolFlow+ Windows application written in C++ Developped and maintained by Roberto Kersevan (CERN) http://test- molflow.web.cern.ch/ Provides stationary-state pressure profiles Molflow+ interface with a model of the FRIB Front End (from the two ECR sources to the RFQ entrance down in the tunnel)
Setting up a model in MolFlow+ 1. Geometry Vacuum chamber CAD model exported to STL; ensuring it is a leak-tight enclosed volume 2. Test-facets Create area over which pressure is measured (i.e. particle hits are counted) 3. Outgassing Thermal outgassing coefficient Any additional sources, e.g. diffusion from ECR source, support gas ions dumped on the analyzing magnet 4. Pumps Pumping speeds for the gas considered Each gas considered separately, simulations for different gases superposed to yield final result In each model: The final pressure profile scales linearly with the outgassing coefficient A single simulation provides pressure profile for various outgassing results Dependence on pumping speeds is more complex (geometry-dependent) Each pumping scheme requires a new simulation run Analyzing magnet in the model of the FRIB Front End with highlighted test-facets along the beam axis
FRIB Front End Simulations in MolFlow+ Simulations were used to validate vacuum system design against requirements Two beam scenarios considered: 1. Uranium beam with oxygen support gas (nominal beam) 2. Argon beam with oxygen support gas (shown here) Pressure requirements Average pressure over FE sections: Extraction Region: 1E-7 Torr Charge Selection Section: 3E-8 Torr Low Energy Beam Transport: 5E-9 Torr Requirements established based on the uranium beam scenario Based on beam transmission requirement of 90% transmission Argon needed to be examined when NEG pumps were introduced NEGs do not pump noble gases
Scenario: Argon Beam with Oxygen Support Outgassing sources: 1. Uniform thermal outgassing from vacuum chamber walls 2. Diffusion from ECR source (upstream end of model): a) Argon atoms b) Oxygen molecules 3. Diffusion from analyzing magnet a) Argon atoms (dumped charges) b) Oxygen molecules (recombined from oxygen ions in the beam) 4. Diffusion from RFQ (downstream end of model) Simulating an open boundary condition to a higher pressure region
Argon & Oxygen Parameters Given by Measurements from the SuSI Source
Scenario: Argon Beam with Oxygen Support SuSI data, case with 3 transported charges (Ar10+, Ar11+, Ar12+) Thermal outgassing: N2 only Average pressure: ER CSS [Torr] LEBT [Torr] [Torr] Req. 1E-7 3E-8 5E-9 N2 1.4E-9 7.6E-9 6.2E-9 O2 (ECR) 3.6E-8 2.6E-9 <5E-10 O2 (magnet) 1.2E-8 3.1E-8 6.0E-10 Ar (ECR) 1.2E-7 8.1E-9 <5E-10 Ar (magnet) 1.9E-8 5.1E-8 1.1E-9 Total 1.9E-7 1.0E-7 8.1E-9
Scenario: Uranium Beam with Oxygen Support Same model as for Argon case, except: No argon, only oxygen Oxygen pressure/concentration obtained from an alternative source (measurement with a uranium beam)
Scenario: Uranium Beam with Oxygen Support Updates since last model: Pumping scheme Magnet temperature = 310 K (was 350 K) Transmission calculation update: Kimura formula used Average pressure: ER CSS [Torr] LEBT [Torr] [Torr] Req. 1E-7 3E-8 5E-9 N2 1.4E-9 7.6E-9 6.2E-9 O2 (ECR) 2.5E-7 1.8E-8 <5E-10 O2 (magnet) 3.1E-8 8.0E-8 1.5E-9 Total 2.8E-7 1.1E-7 8.0E-9
Vacuum Calculation Results Pressure levels obtained from simulations are higher than required levels in some sections, however Consideration of beam transmission has shown that beam losses with simulation results are still acceptable Upgrade paths (additional pumping ports) were added in critical areas
