Understanding Homogeneous Catalysis and Its Advantages
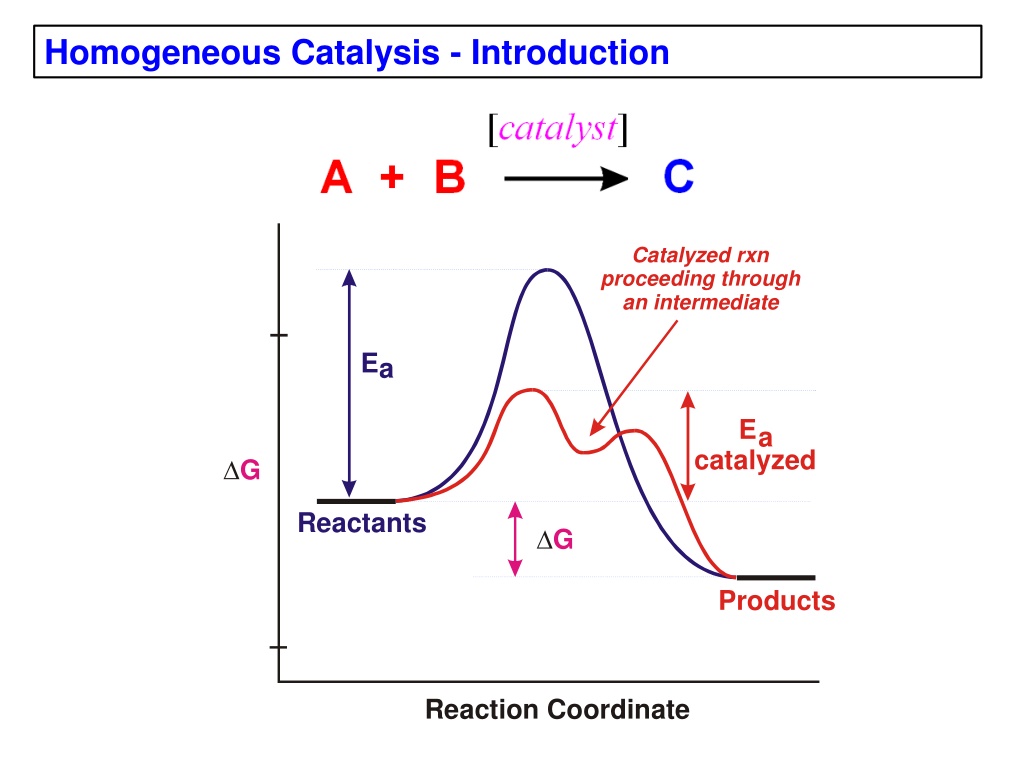
Homogeneous catalysis involves catalyzed reactions proceeding through an intermediate with lower activation energy. This method offers advantages such as selectivity, activity, ease of study, and modification but can be sensitive to deactivation. Comparing with heterogeneous catalysts prevalent in industries, homogeneous catalysts are used for critical selectivity needs. Methods to differentiate homogeneous and heterogeneous catalysts include elemental exposure tests and product selectivity studies. Additional terminology like turnover frequency and number are crucial in understanding catalytic cycles.
Download Presentation

Please find below an Image/Link to download the presentation.
The content on the website is provided AS IS for your information and personal use only. It may not be sold, licensed, or shared on other websites without obtaining consent from the author. Download presentation by click this link. If you encounter any issues during the download, it is possible that the publisher has removed the file from their server.
E N D
Presentation Transcript
Homogeneous Catalysis - Introduction Catalyzed rxn proceeding through an intermediate Ea Ea catalyzed G Reactants G Products Reaction Coordinate
Advantages/Disadvantages of Homogeneous Catalysts Relative to Heterogeneous Catalysts Good homogeneous catalysts are: Good generally far more selective for a single product far more active far more easily studied from chemical & mechanistic aspects far more easily modified for optimizing selectivity Bad far more sensitive to permanent deactivation far more difficult for achieving product/catalyst separations Heterogeneous catalysts dominate chemical and petrochemical industry: ~ 95% of all chemical processes use heterogenous catalysts. Homogenous catalysts are used when selectivity is critical and product- catalyst separation problems can be solved.
Homogeneous or Heterogeneous? There are several general ways to test whether a catalyst is homogeneous or heterogeneous. Exposure to elemental Hg will generally poison a heterogeneous catalyst Exposure to polythiols will poison most homogeneous catalysts Light scattering studies to identify the presence of colloids (heterogeneous) Product selectivity studies: e.g., polymer bound alkenes: Catalyst + H2 Polymer Polymer Homo/Hetero homo Catalyst RhCl(PPh3)3 Ni(OAc)2 + NaBH4 [Rh(nbd)(PR3)2]+ Pd/C [Ir(cod){P(i-pr)3}(py)]+ % Yield 100 hetero -- homo 90 hetero -- homo 100
Some Catalysis Terminology Turnover (TO) -- one loop through the catalyst cycle. Typically one equivalent of reactant is converted to one equivalent of product (per equivalent of catalyst). Turnover Frequency (TOF) or Turnover Rate -- the number of passes through the catalytic cycle per unit time (typically sec, min or hrs). This number is usually determined by taking the # of moles of product produced, dividing that by the # of moles of catalyst used in the reaction, then dividing that by the time to produce the given amount of product. Vinyl Acetate Hydroformylation 0.3mM catalyst -- 85 C/90 psi H /CO sampling from autoclave causes pressure glitches 2 2,000 1,800 4.5 Uptake curve 1,600 4 1,400 Equiv 3.5 kobs = 0.0076 min-1 1,200 Aldehyde Ln( ( P) 1,000 3 Ln plot Prod 800 2.5 600 Initial TOF 2 8 TO/min 476 TO/hr 400 1.5 200 1 0 0 5 10 15 20 Time (hours)
Turnover Number (TON) -- the absolute number of passes through the catalytic cycle before the catalyst becomes deactivated. Academic chemists sometimes report only the turnover number when the catalyst is very slow (they don t want to be embarassed by reporting a very low TOF), or decomposes quite rapidly. Industrial chemists are interested in both TON and TOF. A large TON (e.g., 106 - 1010) indicates a stable, very long-lived catalyst. TON is defined as the amount of reactant (moles) divided by the amount of catalyst (moles) times the % yield of product. Authors often report mole % of catalyst used. This refers to the fraction of catalyst used relative to the amount of limiting reactant present. 10 mole % catalyst 5 mole % catalyst 1 mole % catalyst 0.1 mole % catalyst 0.01 mole % catalyst = 10,000 turnovers = 10 turnovers = 20 turnovers = 100 turnovers = 1000 turnovers These represent the theoretical maximum # of turnovers. One also has to note the % yield or the % conversion of substrate into product to figure out the actual # of turnovers!!
ee (enantioselectivity) this defines the enantioselectivity of an asymmetric catalyst that produces more of one optically active enantiomer (R enantiomer, for example) than the other (S enantiomer). ee is defined as: = + R R S S 100% ee A catalyst that makes an equal amount of R and S enantiomers has 0% ee (a racemic mixture). 85% or higher is generally considered a good ee, although that depends on what the best known catalyst can do relative to that being reported.
Catalysis Data in Publications There is a lot of mediocre/bad catalysis reported all the time in chemistry publications. One often has to dig into the data to figure this out. Things to look for include: 1) # of turnovers performed more is better 2) TOF (turnover frequency) faster is better 3) Good selectivity for the product this includes chemoselectivity, regioselectivity, and enantioselectivity (if applicable) 4) Reaction conditions harsh? Mild? Unusual? Concentrations? To figure out the number of turnovers you need to know the amount of substrate (reactant) and catalyst: # moles (equivalents) reactant (substrate) # moles (equivalents) catalyst Turnovers = The most common alternate way of representing the substrate:catalyst ratio is mole %. This is especially common for organic chemists doing Pd-catalyzed coupling reactions. 10 mole % catalyst means that there is 10% as much catalyst as substrate (reactant) on a molar basis. This is equivalent to 10 turnovers.
Catalyst mole % 10 mole % catalyst 5 mole % catalyst 1 mole % catalyst 0.1 mole % catalyst 0.01 mole % catalyst = 10 turnovers = 20 turnovers = 100 turnovers = 1000 turnovers = 10,000 turnovers
Example: Consider the following catalytic data reported in a J. Am. Chem. Soc. communication (very prestigious) a number of years ago: O + CO + H2O R HO R Hydrocarboxylation
The authors had 7.7 equivalents of reactant, 0.38 equivalents of chiral ligand, and 1 equivalent of Pd. Maximum number of turnovers = equivalents reactant equivalents catalyst 7.7 1.0 = = = max turnovers 7.7 Of course, 7.7 turnovers assumes 100% yield, which they did not get. The actual number of turnovers needs to be reduced by the % yield, which they report as 64%, so the actual number of turnovers is: = 7.7 0.64 = actual turnovers 4.9 What about the TOF? Well you have to read a little footnote to find how long they ran the reaction to get their 64% yield: 18 hours at 1 atm of CO. The TOF is the number of turnovers divided by the time: 4.9 turnovers 18 hr = = hr 1 TOF 0.27
But that 91% ee is quite impressive isnt it. Or is it? The authors only added 0.38 equivalents of the chiral ligand to 1 eq of PdCl2 to generate, at most, 0.38 equivalents of chiral catalyst (assuming one ligand per Pd). This is rather unusual, since one usually adds a little excess of chiral ligand to generate a chiral catalyst, even when dealing with a chelating ligand. OH O O P O BNPPA This ligand is being used under rather acidic conditions (typically needed for Pd- catalyzed hydrocarboxylation) and under these conditions it is highly unlikely that it would be able to function as a ligand. Remember that the late transition metals don t particularly like oxygen donor ligands (weaker bonding). This fact makes the high ee s rather suspect. And a number of research groups (Hoechst Celanese, Union Carbide, etc.) have found (although not published) that the actual ee for this catalyst is close to 0.
Problem: Consider the following catalytic data reported in a recent publication. What information is missing?
Problem: Beller and coworkers have reported (Angew. Chem., 2001, 40, 3408-3411) on hydroformylation catalysis using HRh(CO)(Naphos). The table of catalytic data from their paper is shown below. For experiment # 1, how many turnovers did the authors do? Clearly show how you calculate your number. Is there any important data missing from this table?
Problem: What information is missing from the following Table of catalytic results (they defined the ligands used elsewhere in the paper). How many turnovers are they doing?
