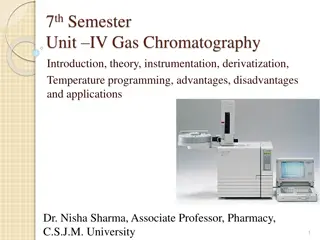
Understanding Gas Chromatography: Theory and Applications
Gas chromatography is a widely used technique in various fields such as research, industry, forensics, and environmental analysis. This method allows for the separation and quantitation of compounds based on their different polarities or physical properties. The setup consists of key parts like an injection block, column, oven, detector, and carrier gas. The theory behind gas chromatography involves interactions with the stationary phase, polarity differences, column temperature, carrier gas flow rate, and column length, all of which influence the outcome of the analysis.
Download Presentation

Please find below an Image/Link to download the presentation.
The content on the website is provided AS IS for your information and personal use only. It may not be sold, licensed, or shared on other websites without obtaining consent from the author. Download presentation by click this link. If you encounter any issues during the download, it is possible that the publisher has removed the file from their server.
E N D
Presentation Transcript
Lecture 9b Gas Chromatography
Introduction Gas chromatography is used in many research labs, industrial labs (quality control), forensic (arson and drug analysis, toxicology, etc.), environmental labs (water, soil, air), and even in the popular TV culture (crime shows like NCIS (Major Mass Spec), CSI, etc.). Used for the quantitation of compounds. Often combined with a mass spectrometer for identification. Traditional equipment requires the use of compounds that are stable enough to be vaporized without decomposition. Mainly useful for small or non-polar molecules. Not useful for large molecules i.e., proteins, polymers, etc. Sometimes polar molecules can be converted into derivatives by using i.e., trifluoromethyl groups to make them more volatile.
Basic Setup Parts: Injection block, column, oven, detector, carrier gas, printer inject sample Oven Injection Block (~200 C) column He recorder (Carrier Gas) detector outlet (reference stream) The temperature of the injection block has to be above 200 oC to ensure a rapid evaporation of the injected sample. The temperature of the detector has to be 20-30 oC above the final column temperature to prevent condensation of the compounds. a
Theory of Gas Chromatography I Like in many chromatographic techniques, the separation of compounds in a mixture is based on different polarities in a direct (interaction with stationary phase) or indirect way (physical properties i.e., boiling point). The gas chromatography column consists of solid support that is covered with a high-boiling liquid in a thin capillary tube. In the example above, compound X has a higher affinity towards the stationary phase compared to compound O . Compound O elutes before compound X off the column because of the weaker interaction with the stationary phase. time O X
Theory of Gas Chromatography II What influences the outcome in the gas chromatography run? The vapor pressure of the compound The higher the boiling point is, the lower the vapor pressure of the compound is and the slower the compound is going to migrate through the column resulting in a longer retention time. The polarity of the compound compared to the polarity of the column The more the polarities are alike, the stronger the interaction of the compound with the stationary phase is going to be, which increases the retention time particularly for more polar compounds. The column temperature A lower temperature allows for more interaction of the compound with the stationary phase, thus longer retention times with better separation will be observed.
Theory of Gas chromatography III Carrier gas flow rate A higher flow rate allows for less interaction with the stationary phase, thus shorter retention times with poorer separation will be observed. Column length A longer retention time with better separation will be observed but also peak broadening due to increased longitudinal diffusion. Amount of the material injected If too much material is injected, close peaks will overlap, which makes the identification (i.e., mass spectrometry) and quantitation more difficult if not impossible. The conditions have to be adjusted for each separation problem which will be very difficult if the compounds to be separated have similar very properties. The goal is to optimize the separation and the retention time.
Detectors I FID (Flame Ionization Detector) Advantages: It is very sensitive for most organic compounds (1 pg/s) Low sensitivity for small molecules i.e., N2, CO, CO2, H2O Disadvantages: The sample is destroyed It requires three gases (carrier gas (i.e., helium, argon, nitrogen), hydrogen and air/oxygen)
Detectors II TCD (Thermal Conductivity Detector) Advantages: The sample is not destroyed and can be collected after passing through the column. Only one gas with a high thermal conductivity needed i.e., helium, hydrogen. Disadvantages: The method possesses a significantly lower sensitivity compared to FID. http://upload.wikimedia.org/wikipedia/commons/thumb/c/cb/Thermal_Conductivity_Detector_1.svg/220px-Thermal_Conductivity_Detector_1.svg.png ECD (Electron Capture Detector) Advantages: It is very sensitive for chlorinated compounds i.e., TCDD, PCB, etc. Disadvantages: It requires a radioactive source and special license to operate these sources! Several carrier gases needed for the ionization i.e., argon/methane.
Sample Identification Mass spectrometer Spiking: the sample is run with and without the addition of a spike, which is an authentic sample of compound to be identified. Original spectrum B A Spike B added If compound A was added as the spike, peak A would increase in area. If the spike was not a compound in the mixture, an additional peak would be observed. This method is semi-quantitative.
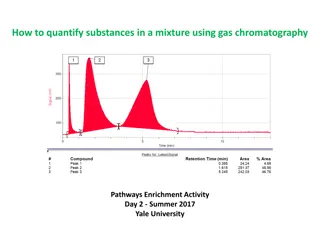
Experiment In this week lab, after distillation, the teaching assistant will inject ~ 1 l into the GC (Not more than that because it will overload the GC and render it useless!) The period following injection that is required for a compound to pass through the column is called the retention time. The GC will separate the two liquids and the computer attached to the GC plots the peak(s) for each liquid. A typical gas chromatogram looks like shown below. The area under a gas chromatograph peak is proportional to the amount (moles) of the compound eluted. Hence, the molar percentage composition of a mixture can be approximated by comparing relative peak areas. The simplest method of measuring the area of a peak is by geometrical approximation using a triangle. Approximate area = h*w Where, h is the height of the peak above the base line and w is the width of the peak at half of its height.
