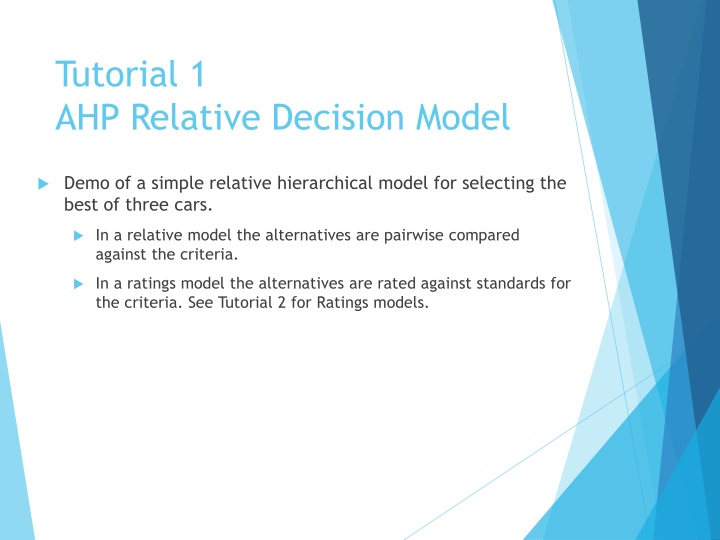
Tutorial 1 AHP Relative Decision Model
In this model, three cars - Honda Civic, Acura TL, and Toyota Camry - are compared based on criteria such as MPG, price, prestige, and comfort. The hierarchy is built in the SuperDecisions software, enabling a systematic evaluation of the alternatives. This demonstration guides in creating pairwise comparisons to make an informed decision on the best car choice.

Download Presentation

Please find below an Image/Link to download the presentation.
The content on the website is provided AS IS for your information and personal use only. It may not be sold, licensed, or shared on other websites without obtaining consent from the author.If you encounter any issues during the download, it is possible that the publisher has removed the file from their server.
You are allowed to download the files provided on this website for personal or commercial use, subject to the condition that they are used lawfully. All files are the property of their respective owners.
The content on the website is provided AS IS for your information and personal use only. It may not be sold, licensed, or shared on other websites without obtaining consent from the author.
E N D
Presentation Transcript
Tutorial 1 AHP Relative Decision Model Demo of a simple relative hierarchical model for selecting the best of three cars. In a relative model the alternatives are pairwise compared against the criteria. In a ratings model the alternatives are rated against standards for the criteria. See Tutorial 2 for Ratings models.
SuperDecisions Opening Screen upon launching the software * File > New command leaves the same blank opening screen
Main Menu Commands File New brings up templates, Open file, Close file, Recent Files, Backups, Import model in .txt format, Export supermatrices to .txt files, Print model report, Old files have .mod extensions, new files have .sdmod extensions Design Build a network by creating clusters and nodes and making node connections Assess/Compare Perform pairwise comparisons, access the Ratings spreadsheet if there is one Computations Synthesize results, look at supermatrices, perform sensitivity, do sanity check for errors and incomplete comparisons Network quickly transit around the sub-networks in a complex model and go going directly into a selected subnet Test Programmer menu for development work Help Sample models, including some in other languages, Help, for now use this old Help file: http://www.superdecisions.com/SuperDecisions_Help.pdf
A Three-Level Hierarchy to Choose the Best Car Goal Buy Best Car MPG (Miles per gallon) Price Prestige Comfort Honda Civic Acura TL Toyota Camry
The Cars Acura TL Cost $30,000-$35,000 Miles per Gallon 20/29 (City/Hwy) Prestige is very good Comfort is excellent Toyoto Camry Cost $22,000 - $28,000 Miles per gallon 22/30 (City/Hwy) Prestige is good Comfort is good Honda Civic Cost $16,000 - $20,000 Miles per gallon 29/38 (City/Hwy) Prestige is good green car Comfort is medium to low
The Decision Hierarchy as it appears in the SuperDecisions Software Cluster Node All links are among nodes: the cluster link is automatically created because some node(s) in the Criteria cluster are connected to some node(s) in the Alternatives cluster See the SuperDecisions software model: Tutorial_1_Acura_Relative_Model.sdmod
Building the Decision Hierarchy File>New and choose Simple Network (simply leaves you with a blank window) or just start building on the blank opening screen To create the Goal Cluster select the Design command: Design>Cluster>New brings up the cluster editing window. Type a name and description for the cluster and set the parameters: font, text size, color, icon (if you want) and save.
Decision Hierarchy with a new cluster to hold the Goal Node Double-click on a cluster to minimize it to an icon or expand from an icon.
Add Goal Node to Goal Cluster Design>Node>New to get to the node editing window. Select cluster to add node to, enter goal node name (and description if you wish) selecting parameters as before, and save. For convenience, just use the word Goal again. To display descriptions make sure the Icon on the top menu bar is depressed then hold cursor over node or cluster.
Add the Rest of the Clusters and Nodes Double-click a cluster to minimize or expand To re-size a cluster click on bottom right hand button on a cluster and drag. IMPORTANT! The cluster holding the alternatives must be named with some version of the word Alternatives (prefacing with a number is OK) Note: Prefacing Cluster and node names with numbers allows you to control their order in the supermatrices as they are appear in alphabetical order there.
Build the Hierarchy in SuperDecisions Step 1. Create the clusters and nodes shown below Or use the shortcut to connect nodes Use the Design>Node Connexions from menu command to connect the Goal Node to the Criteria: To turn on the connection shortcut mode left-click the connections icon.
Complete the Rest of the Connections Turn on the fan-shaped Show Connections icon by clicking it Connect each of the four nodes in the Criteria cluster to all three of the alternative nodes. Hold your cursor over a node such as Comfort -, to display nodes it is connected to outlined in red. When the judgments for these nodes with respect to Comfort have been marked as completed, their window will also appear with a red outline.
Connecting Nodes: Menu or Shortcut 1 Click the Make connections icon to depress it and enter the shortcut make connections mode. 2 Left-click the from node Selected nodes are depressed and outlined in black 3 Right-click each to node (which outlines them in red) 4 Line then automatically appears from Goal cluster to Criteria cluster To input a picture for a node or cluster icon use the Design>Node>Edit command , click, the Change Icon command and select a picture. To add your own pictures to the available collection, copy your picture files into the C:/Program Files/Super Decisions/Icons folder (*.gif files work pretty well).
Connect Criteria Nodes to Alternative Nodes SHORTCUT to connect many nodes at once Shift left-click on any from node in a cluster - selects all nodes Shift right-click on any to node connects all from nodes to all to nodes Line automatically appears between clusters
Remove Unintended Loops A loop will appear on a cluster when a node or node(s) are connected to other node(s) in the same cluster. REMOVING LOOPS Right click on the background of the cluster with the loop and select the Remove self loop command.
Unweighted Supermatrix before making any pairwise comparisons Supermatrices are square; every node appears as a column and a row. The priorities, that add up to 1.0, are read from the columns. The nodes connected from a node are shown in the column below that node; for example, the Goal node is connected to the criteria nodes and they are equally weighted at .25 before making pairwise comparisons. Cluster names Node names Priorities of Criteria nodes
Making Pairwise Comparisons Click on the Goal Node to select it. Click the pairwise comparison/assessment icon on the menu bar to enter the assessment mode or use the Assess/Compare command. The Questionnaire Pairwise Comparison Mode opens by default. Click on the Matrix tab to switch to the Matrix Mode.
More About the Compare/Assess Mode There are 5 possible modes for entering assessments; judgments entered in one mode will appear as the equivalent judgment in any other mode. Choose tab indicating whether comparing nodes or clusters (cluster comparisons not possible in hierarchies) Selector for parent node of comparison Selector for cluster containing nodes linked from parent node, to be compared with respect to it Restore button will bring back original judgments for selected comparison group when revisiting comparisons
Example of a Pairwise comparison Matrix in SuperDecisions and in traditional AHP In the AHP Theory view you see 9 judgments Only 3 judgments are necessary Acura Civic Camry 1 8 1 4 4 Acura 1/8 1/4 1/4 1 Civic Camry Diagonal elements are always 1, so they do not need to be displayed. The elements below the diagonal are always inverses of the judgment in the reciprocal cell above, so they do not need to be displayed (e.g. 1/8 8). aij = 1/ aji AHP reciprocals are shown in red in SuperDecisions. For example, 4.0 means for1/4.
Start Making Pairwise Comparisons 1. Left-click on Goal node to select it 2. Left-click on make assessments icon Comparison/Assessment Questionnaire mode appears. 3. Switch to the Matrix mode by clicking on matrix tab. Change the comparative phrase 1Prestige is ????times more Preference than 2Price by left-clicking on it and choosing importance. . Note the copy commands. You can then paste into Excel or Word.
Enter Judgments (Matrix Mode) 1. Enter judgments in cells by typing numbers from Fundamental Scale. The direction of the arrow indicates which criterion is more important. Double-click on arrow to change dominance direction. The first element in the comparative phrase is the dominant one. Up arrows are red, down arrows are blue. The current parent node is the Goal node and the Criteria nodes are being compared with respect to it for importance. The inconsistency should be less than 0.10. 2. Inconsistency=0.07685; Derived Priorities Mark completed and move to next comparison
Improve Consistency (available only from Matrix Mode) Click on the Inconsistency button (at top left corner of matrix) Choose Basic Inconsistency Report; the first cell, Prestige versus MPG, currently has a red 3 in it meaning that MPG are more important than Prestige (see previous view of matrix), but the Best Value of 1.05 (in blue) means Prestige is a little more important than MPG and the inconsistency would be improve down to 0.01 if that were the judgment Left-click on either the Current or Best Value cell to return to the matrix and input a new value . You can use the suggested value, or a value between it and the original value, or leave it as it is and go to the number 2 most inconsistent judgment (MPG versus Comfort) and change that, and so on. See next slide.
Matrix View after Improving Judgment of MPG vs Prestige Although the original inconsistency of 0.07 passes the .10 test, it can be improved. New judgment Better Inconsistency of 0.01.
Derived Priorities are placed in Supermatrix
Other Comparison Modes Graphical Click and drag on circle (NOT the bars) to change judgment Verbal Tracking shows which judgment you are on in equivalent matrix view Click button to invert dominance
The Questionnaire Mode The Assessment/Compare command opens the pairwise comparison mode by default. Choose the judgment on the left or right side of the zero on the questionnaire line that is nearest to the more important, more preferred, or more likely, node. Here price is more important than prestige. If necessary, and it is here, change the verbal phrase so it reads correctly, as explained below. In the view above the questionnaire opened with the wrong dominance word, moderately to strongly more Preference . Left click on the dominance phrase itself to get the menu of possible phrases and select the most appropriate word.
Direct Data Assessment Mode Enter direct data in the Direct mode. It may be already normalized, as shown here, or it may be numbers representing costs or distances. Important! Click <Enter> or move away from last judgment entered to make sure it has registered Click the Invert box when the priorities are inversely related to the data such as distance, farther is lower priority, or cost, more expensive is lower priority.
Weaknesses of using Direct Data Data may not be as good as judgments in determining your personal priorities. It would usually be better to use your judgment about what the price of a car means to you rather than use the the data directly. Suppose you are a poor college student. See the two results below. Which do you think more accurately reflects the reality? Priorities from judgments Priorities from data Comparing cars for price using judgments
Compare Cars for Prestige and Price Prestige Comparisons Price Comparisons
Compare Cars for MPG and Comfort MPG Comparisons and Priorities Comfort Comparisons and Priorities
The Supermatrices Computations>Unweighted Supermatrix: matrix containing the priorities from the pairwise comparisons. Computations>Weighted Supermatrix: The unweighted supermatrix components have been multiplied by cluster weights. In a hierarchy there are no cluster weights and the weighted supermatrix is the same as the unweighted. Computations>Limit Supermatrix: The limit matrix is obtained by raising the weighted supermatrix to powers until it converges to give the answer. 1. 2. 3.
The Unweighted Supermatrix after all Judgments Completed
Synthesize to get Overall Results Select Computations>Synthesize or click to get the final results: the priorities of the alternatives. You MUST name the Alternatives cluster with some variation of the word alternatives to get an answer. Acura TL 0.344 Toyota Camry 0.200 Honda Civic 0.456 The Raw values come from the Limit Supermatrix. The Normalized values are obtained from them by summing and dividing each by the sum. The Ideals are obtained by dividing the Raw values by the largest Raw value
Sanity Check The Computations>Sanity Check will reveal incomplete comparisons and duplicate goals, among other things. Each time you finish a set of comparisons you must mark it complete before proceeding to the next set. Unintentionally skipped comparisons will also be caught by the Sanity Check.
WARNING! No Alternatives Found This error message will appear if there is no cluster named some version of the word alternatives, IN ENGLISH, but for example, 3alternatives is an acceptable name. The SuperDecisions software uses this word to find for which nodes it should deliver synthesized priorities extracted from the raw values in the limit supermatrix. To obtain synthesized priorities for any other nodes go to the limit supermatrix, get the raw values, and normalize them yourself. The Normals are the raw values divided by their sum. The Ideals are the raw values divided by the largest raw value.
Graphical Sensitivity 1. To do graphical sensitivity select the Computations>Sensitivity command 2. Select Edit>Independent Variable to get to the Sensitivity input selector box and change the Independent Variable to the Goal. The first graph that appears has the first node, alphabetically, selected as the with respect to node. It is generally not the one you want. Here you need to select the Goal, not the Acura TL, as the independent variable
Graphical Sensitivity (contd) Step one. Select the Edit>Independent Variable command Step two. In the Selected Node box highlight the current node (Acura) then lick Edit. Step three. In the Input Parameter Box select Parameter Type: Supermatrix, the Goal as Wrt Node ( with respect to ) and select one of the criteria as the 1st other node, for example, choose Prestige. Click on the button to the right to get the drop down box with the other choices.
Getting Sensitivity Graph for Prestige Set Parameters Box Show Selected Node Box 1 2 Sensitivity Graph for Selected node(s) Updated Parameters click Update for results Priority of Prestige is given on x-axis; vertical line starts at Prestige priority of 50%; car priorities for Prestige=50% priority are shown by intersections with vertical line. 3 4
Interpreting Sensitivity of Prestige At Prestige = 50%, Acura is best At Prestige = 9.2% (actual priority in model), Civic is best Click and drag vertical line to change priority of Prestige on horizontal axis from 0.5 to 0.1. The analysis: If your priority is less than about 25% for Prestige, the Honda is the car to buy. For any priority greater than that, the Acura is your best car.
Priorities of all Nodes in Model Select Computations>Priorities command to see the priorities of all nodes in model Limiting priority column shows priority of Prestige compared to all the other nodes in the entire model. Normalized by Cluster column shows the priority of Prestige (.096) compared to the other criteria in its cluster. Drag the vertical line from .5 to .096 on the x-axis in Sensitivity to show the priorities of the cars at the model priority of .096 for Prestige.
Dynamic Sensitivity Select Computations>New Sensitivity to get into Dynamic Sensitivity Mode Click on Node for Sensitivity selector button at right and change from Goal Node, shown here, to 1Prestige.
Dynamic Sensitivity - Prestige The Prestige parameter can be dragged from 0.00 to 1.00. At 0.50, the priorities of the cars are the same as the overall synthesized result priorities of 0.344, 0.200 and 0.456.
Dynamic Sensitivity At a parameter value of 1.00 for Prestige the most prestigious car, the Acura is clearly the best choice.
Putting Subcriteria into a Hierarchical Model Create separate clusters for the subcriteria of the criteria that will have subcriteria. Price has subcriteria of initial cost and maintenance, which then connect to the cars. Comfort has subcriteria of Ride and Driving Performance which then connect to the cars. Prestige and MPG have no subcriteria and connect directly to the cars.
Exporting Supermatrices The following files may be exported as .txt files using the File>Export command: Unweighted Supermatrix Weighted Supermatrix Limit Supermatrix Cluster Matrix Import into Excel using the File>Open command. Launch Excel. File>Open and be sure to select All Files for type of file so the .txt file you exported will appear. Click yes throughout the wizard to open the exported supermatrix in an Excel spreadsheet.
Reports The Computations>Full Report command and the File>Print command both generate the same HTML file of reports about the model. You may use the Print Preview version, or save as a .html file. The report gives the names and descriptions of the nodes and clusters and important priorities.


")


")