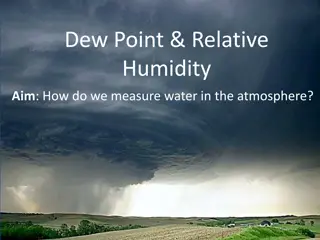
Impact of Climate Change on Winter Haze Pollution in Beijing: Role of Relative Humidity
Relative humidity plays a crucial role in the formation of winter haze pollution in Beijing. Studies show a high correlation between wintertime PM2.5 levels and variables like meridional wind velocity and relative humidity. However, the effect of climate change on Beijing haze in the 21st century is projected to be insignificant. Research also explores extreme haze events and their probability using meteorological variables. Overall, understanding the impact of relative humidity on winter haze pollution is essential for addressing air quality issues in Beijing.

Download Presentation

Please find below an Image/Link to download the presentation.
The content on the website is provided AS IS for your information and personal use only. It may not be sold, licensed, or shared on other websites without obtaining consent from the author.If you encounter any issues during the download, it is possible that the publisher has removed the file from their server.
You are allowed to download the files provided on this website for personal or commercial use, subject to the condition that they are used lawfully. All files are the property of their respective owners.
The content on the website is provided AS IS for your information and personal use only. It may not be sold, licensed, or shared on other websites without obtaining consent from the author.
E N D
Presentation Transcript
Effect of climate change on winter haze pollution in Beijing: relative humidity as a critical variable Daniel J. Jacob, Harvard University Drew Pendergrass Lu Shen
Relative humidity is a chemical driving factor of winter haze Hourly winter 2014 observations in Beijing Higher RH increases aqueous aerosol mass to drive sulfate and organic PM production, but this chemistry is missing from standard models , Song et al., ACPD 2018
High statistical correlation of Beijing wintertime PM2.5 with meridional wind velocity (V850) and relative humidity (RH) Correlations for DJF monthly mean PM2.5 record from US embassy, 2010-2017 Even stronger correlation (R = 0.90) with principal component PC1 of V850 and RH: PC1 = 0.5V850 (normalized) + 0.5RH (normalized) PC1 provides meteorological proxy for Beijing haze: no significant trend 1970-present Shen et al., ACPD 2018
Correlations of PC1 with Arctic sea ice cover and sea surface temperature are complicated and vary on multidecadal time scales Correlation of PC1 with sea ice cover (SIC) in winter and previous fall, 1973-2017 The correlation is with a variable dipole not very useful for future-climate projections Shen et al., ACPD 2018
Effect of 21st century climate change on winter mean Beijing PM2.5 as projected from the proxy PC1(V850, RH) 2080-2099 vs. 2000-2019 changes in IPCC CMIP5 models for RCP 8.5 scenario Mean change in V850 Mean change in RH Change in PM2.5 In individual models 75th 25th current winter mean PM2.5 = 110 g m--3 Effect of climate change on Beijing haze is insignificant Shen et al., ACPD 2018
What about extreme haze events? Observed frequency distribution of wintertime 24-h PM2.5 in Beijing, 2009-2017 Apply extreme value theory to fit probability of extreme events to meteorological variables: point process model 95th percentile Consider ensemble of meteorological variables including V850, RH, vertical temperature gradient ( T850-250), meridional gradient of 500hPa zonal wind ( U500) Pendergrass et al., submitted to GRL
Best point process model fit of extreme haze events is to V850, RH Contours: model probability Dots: observed daily PM2.5 green: > 300 g m-3 black: < 300 g m-3 The same model correctly predicts probability for higher thresholds Pendergrass et al., submitted to GRL
Implications for effect of climate change on extreme haze Changes in (V850, RH) joint probability in CMIP5 models, 2051-2060 vs. 2006-2015 extreme haze regime Pendergrass et al., submitted to GRL
RCP8.5 future climate scenario Changes in (V850, RH) joint probability in CMIP5 models, 2051-2060 vs. 2006-2015 extreme haze regime RCP8.5 scenario shows no change for the (V850, RH) range leading to extreme events Pendergrass et al., submitted to GRL
RCP4.5 future climate scenario Changes in (V850, RH) joint probability in CMIP5 models, 2051-2060 vs. 2006-2015 extreme haze regime RCP8.5 scenario shows no change for the (V850, RH) range leading to extreme events RCP4.5 shows decreased probability of the (V850, RH) range leading to extreme events Pendergrass et al., submitted to GRL
2006-2015 to 2051-2060 change in probability of extreme haze computed for each CMIP5 model by integrating over pdfs of meteorological variables # extreme haze days per winter (CMIP5 ensemble) RCP4.5 RCP8.5 Number of extreme haze days per winter point process model function of V850 and RH only (best model) -10% ~ 0% -10% -10% function of V850, RH, T850-250 , U500 (inferior model) +20% +10% function of V850, T850-250 , U500 (poor model, omitting RH ) Frequency of extreme haze events is most likely to decrease as result of climate change, but not including RH as predictor variable would conclude to an increase Pendergrass et al., submitted to GRL