Trends in Health Premium Increases 1999-2014
The trends in average premium increases for covered workers with family coverage from 1999 to 2014, along with changes in worker and employer premium contributions and the prevalence of health promotion programs in large firms. The data highlights the rise in annual premiums and variations based on wage levels.

Download Presentation

Please find below an Image/Link to download the presentation.
The content on the website is provided AS IS for your information and personal use only. It may not be sold, licensed, or shared on other websites without obtaining consent from the author.If you encounter any issues during the download, it is possible that the publisher has removed the file from their server.
You are allowed to download the files provided on this website for personal or commercial use, subject to the condition that they are used lawfully. All files are the property of their respective owners.
The content on the website is provided AS IS for your information and personal use only. It may not be sold, licensed, or shared on other websites without obtaining consent from the author.
E N D
Presentation Transcript
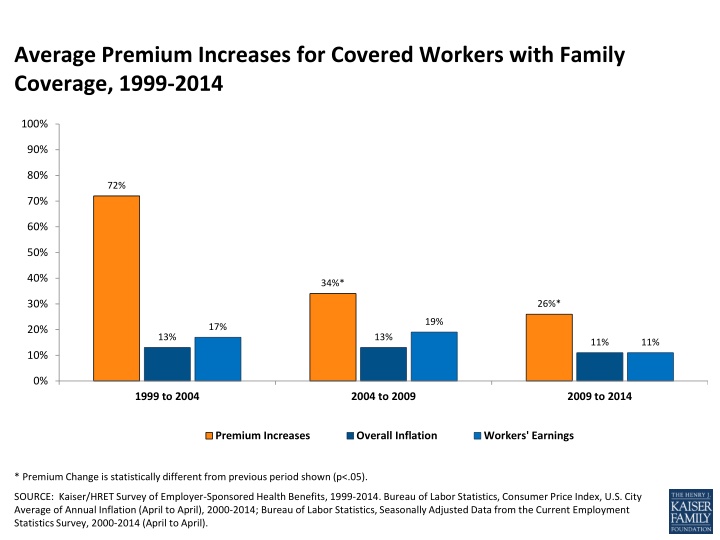
Average Premium Increases for Covered Workers with Family Coverage, 1999-2014 100% 90% 80% 72% 70% 60% 50% 40% 34%* 30% 26%* 19% 17% 20% 13% 13% 11% 11% 10% 0% 1999 to 2004 2004 to 2009 2009 to 2014 Premium Increases Overall Inflation Workers' Earnings * Premium Change is statistically different from previous period shown (p<.05). SOURCE: Kaiser/HRET Survey of Employer-Sponsored Health Benefits, 1999-2014. Bureau of Labor Statistics, Consumer Price Index, U.S. City Average of Annual Inflation (April to April), 2000-2014; Bureau of Labor Statistics, Seasonally Adjusted Data from the Current Employment Statistics Survey, 2000-2014 (April to April).
Average Annual Premiums for Single and Family Coverage, 1999-2014 $2,196 1999 $5,791 Single Coverage $2,471* 2000 $6,438* Family Coverage $2,689* 2001 $7,061* $3,083* 2002 $8,003* $3,383* 2003 $9,068* $3,695* 2004 $9,950* $4,024* 2005 $10,880* $4,242* 2006 $11,480* $4,479* 2007 $12,106* $4,704* 2008 $12,680* $4,824 2009 $13,375* $5,049* 2010 $13,770* $5,429* 2011 $15,073* $5,615* 2012 $15,745* $5,884* 2013 $16,351* $6,025 2014 $16,834* $0 $2,000 $4,000 $6,000 $8,000 $10,000 $12,000 $14,000 $16,000 $18,000 * Estimate is statistically different from estimate for the previous year shown (p<.05). SOURCE: Kaiser/HRET Survey of Employer-Sponsored Health Benefits, 1999-2014.
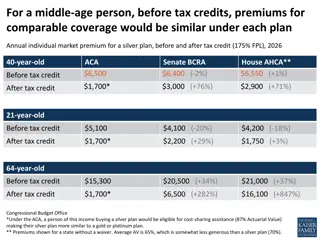
Average Worker and Employer Premium Contributions For Covered Workers at Higher- and Lower-Wage Firms Enrolled in Family Coverage, 2014 $20,000 $17,582 $18,000 $16,834 $16,000 $14,177 $14,000 $12,000 $13,084 $12,011 $7,706 $10,000 $8,000 $6,000 $4,000 $6,472 $4,823 $4,497 $2,000 $0 Many Workers are Lower-Wage Many Workers are Higher-Wage All Firms Employer Premium Contribution Worker Premium Contribution *Estimate for many workers are lower-wage is statistically different from estimate for many workers are higher-wage, within coverage type (p<.05). NOTE: Firms with many lower-wage workers are ones where 35% or more of employees earn $23,000 or less. Firms with many higher-wage workers are ones where 35% or more of employees earn $57,000 or more. Wage cutoffs are the inflation adjusted- 25th and 75th percentile of national wages according to Bureau of Labor Statistics using data from the Occupational Employment Statistics (OES). 1% of covered workers are in firms which are both high income and low income, excluding these firms does not change the estimates or significance testing. SOURCE: Kaiser/HRET Survey of Employer-Sponsored Health Benefits, 2014. Bureau of Labor Statistics. Occupational Employment Statistics Available from: http://www.bls.gov/oes/oes_emp.htm#scope
Among Large Firms (200 or More Workers) Offering Health Benefits, The Prevalence of Various Health Promotion Programs, 2014 98% 100% Large Firms (200 or more Workers) 80% 60% 51% 51% 40% 20% 0% Offers at least one Wellness Program~ Firm Offers Biometric Screening Firm Provides Employees the Opportunity to Complete a Health Risk Assessment *Percent of firms offering incentives is among firms offering health benefits who also offer the specified health program or activity. ~ Includes the following wellness programs: weight loss programs, biometric screenings, gym membership discounts or on-site exercise facilities, smoking cessation program, lifestyle or behavioral coaching, classes in nutrition or healthy living, web-based resources for healthy living, flu shots or vaccinations, or employee assistance programs (EAP) or a wellness newsletter. ``Biometric screening is a health examination that measures an employee's risk factors such as cholesterol, blood pressure, stress, and nutrition. A health risk assessment includes questions about medical history, health status, and lifestyle and is designed to identify the health risks of the person being assessed. SOURCE: Kaiser/HRET Survey of Employer-Sponsored Health Benefits, 2014.
Percentage of All Workers Covered by Their Employers Health Benefits, in Firms Both Offering and Not Offering Health Benefits, by Firm Size, 1999-2014 All Small Firms (3-199 Workers) All Large Firms (200 or More Workers) ALL FIRMS 80% 69% 69% 68% 68% 67% 70% 66% 66% 66% 65% 65% 64% 63% 63% 62% 62% 65% 61% 63% 63% 62% 62% 61% 60% 60% 60% 59% 59% 59% 59% 58% 56% 56% 55% 58% 57% 55% 54% 50% 53% 53% 52% 52% 50% 50% 50% 49% 48% 47% 46% 44% 40% 30% 20% 1999 2000 2001 2002 2003 2004 2005 2006 2007 2008 2009 2010 2011 2012 2013 2014 * Estimate is statistically different from estimate for the previous year shown (p<.05). SOURCE: Kaiser/HRET Survey of Employer-Sponsored Health Benefits, 1999-2014.
Among Covered Workers with a General Annual Health Plan Deductible for Single Coverage, Average Deductible, by Firm Size, 2006-2014 All Small Firms (3-199 Workers) All Large Firms (200 or More Workers) ALL FIRMS $2,000 $1,797 $1,715 $1,800 $1,596 $1,537 $1,600 $1,391 $1,400 $1,254 $1,124 $1,217 $1,200 $1,135 $1,097 $1,000 $991 $852 $917 $775 $971 $826 $800 $884 $875 $735 $757 $616 $600 $584 $686 $640 $553 $400 $519 $496 $200 $- 2006 2007 2008 2009 2010 2011 2012 2013 2014 NOTE: Note: Average general annual health plan deductibles for PPOs, POS plans, and HDHP/SOs are for in-network services. SOURCE: Kaiser/HRET Survey of Employer-Sponsored Health Benefits, 2006-2014.


 Offering Health")