Thermal Transfer Measurements: Innovative Methods
Mining Applications and Chemometrics
www.spectralevolution.com
www.spectralevolution.com
Incorporated 2004
Full line supplier of UV-VIS-NIR
spectrometers for lab, inline process &
field portable remote sensing
Mfg facility in North Andover , MA
OEM manufacturer
>100 field portable UV-VIS-NIR
instruments in field use worldwide
Field portable full range UV-VIS-NIR
spectrometers & spectroradiometers
Laboratory full range UV-VIS-NIR
spectrometers & spectroradiometers
Single detector InGaAs photodiode array lab
spectrometers
Single detector Si spectrometers,
spectroradiometers & spectrophotometers
Light sources & accessories
Spectrometers for mining
exploration, mineral
identification, and
production
oreXpress™
Full range portable spectrometer
for mining and mineral identification
oreXpress Platinum
Also includes a range of FOV lenses, internal
battery, membrane control panel for standalone
operation, and on-board storage for 1,000 spectra
oreXpress & oreXpress Platinum
True field portability <7 lbs
Full range UV/VIS/NIR – 350-2500nm
Fast/High Signal to Noise ratio
for better reflectance values
Unmatched stability & performance
through SWIR2
DARWin SP Data Acquisition
software saves scans as ASCII files for
use with 3
rd
party software
EZ-ID real-time mineral ID with
USGS & SpecMIN libraries
EZ-ID™ Software with Library Builder
Module
Real-time mineral identification
in the field
USGS and SpecMIN libraries
Select different spectral regions of interest
Compare unknown mineral sample spectra to known
library
Best match score quickly and automatically displayed
Qualitative & Quantitative Analysis
Use EZ-ID for mineral identification and qualitative
analysis
What is there
Use reflectance spectroscopy and chemometrics for
quantitative analysis
How much is there
Widely used in mining
exploration and mineral
identification
Identification of key alteration
minerals associated with potential
economic deposits
Qualitative mineralogy describes
the process of using NIR to quickly
ID mineral species during exploration
Usage is typically bound by cost (high) and speed
(slow)
Available examples:
Qemscan/MLA
Quantitative X-ray diffraction
Better solution – Quantitative Reflectance
Spectroscopy
Analyze a greater number of samples in less time, at an
affordable cost
Use mineralogical and metallurgical information from
a representative set of samples and correlated
reflectance spectra to develop statistical calibration
models
Calibration “trains” the spectrometer to analyze
additional unknown samples
Leverage the detailed, more costly analysis of a few
samples to analyze a much larger set of related
samples
Useful for mining process optimization
Real-time or near real-time knowledge of mineralogical and
metallurgical properties that impact metal recovery, allows
for
▪
Intelligent ore sorting
▪
Optimization of ore processing
Useful for gangue minerology to minimize process
cost and increase yield
Gangue can affect extractability
▪
Talc and hornblende interfere with flotation
▪
Carbonates increase acid costs
▪
Clays can reduce yield due to loss of heap permeability
www.spectralevolution.com
oreXpress
Mineral
Analysis/
Identification
www.spectralevolution.com
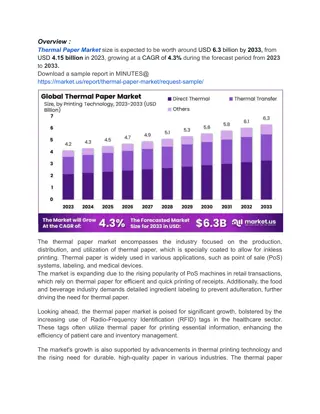
Iron Minerals
www.spectralevolution.com
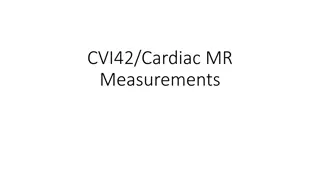
Calcite
Talc
Hornblende
www.spectralevolution.com
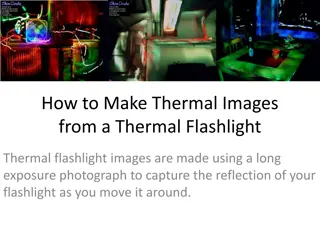
Clays
Advantages of reflectance spectroscopy
High throughput
Hundreds to thousands of samples per day – ideal for rapid
blast hole chip analysis
Frequent (<1 minute intervals) measurements for in-process
sensors
Non-contact measurements
Simultaneously determine multiple properties
Create
Standards
Collect
Spectra
Predict
Concentrations
Build,
Optimize &
Test Model
Measure
Unknown
Access
Model
Prepare Calibration Set
Samples should reflect the physical properties and diversity
that will be encountered in the field
Analyze the properties of interest using appropriate reference
analytical methods, such as:
Qemscan
X-ray diffraction
Acid consumption
Other metallurgical tests
Measure the reflectance spectra
Things to consider in measuring spectra
Features can overlap and may not be from a single component
Spectral features in minerals can result from crystal field
effects, charge transfer, color centers, and conduction band
transitions
Spectral features in organic and industrial samples come
primarily from CH, NH, OH, and SH bonds
Multivariate models can consider all, or a substantial portion of
the whole spectrum
Develop and validate your calibration
Match each reflectance spectrum you have collected to the
corresponding reference analyses
Develop calibration equations using multivariate chemometric
techniques like partial least-squares regression
Validate the performance of the calibration by using an
independent set of samples
How to select a reference method
NIR is a secondary method – the reference needs to be well
controlled with the lowest possible error
The Standard Error of Laboratory (SEL) should be known and
documented
If there are changes in the reference method, new reference
data may be substantially different from your original data
Submission of known samples is a good idea
Things to consider in collecting spectra
Verify your system performance using wavelength standards
Control particle size, moisture, temperature, and sample
packing , or stabilize your model to resist changes in these
parameters
Use the same sample preparation as optical geometry can
affect your outcome
Now apply your calibration
Prepare unknown samples with the same method used for
calibration samples
Measure the reflectance spectrum of the unknown using the
same set-up used in building the calibration
Apply the calibration to the unknown reflectance spectrum to
predict mineralogical and metallurgical properties
How many samples will I need for calibration and test?
Reserve 20% of samples for an independent test set
60-90 samples for a feasibility study
120-180 for starting model
>180 for a robust production model
How many samples will I need for calibration and
validation?
Cover the anticipated range of composition
Scan in the form that will be analyzed by the model – make
them match
Contain a natural combination of minerals - avoid blending as
it can cause problems, beware cross correlations
Ensuring that your model retains its integrity
Watch out for samples with high spectral residual and samples
that predict at or near the extremes of your model
Establish a consistent monitoring program with reference
analysis done frequently
Implement a plan and schedule for improvement of the model
including identifying new samples
Establish criteria for revising the model based on time,
increased validation error, or similar characteristics
Examples of chemometric analyses using reflectance
spectroscopy
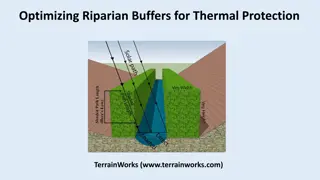
Uncover insights on thermal transfer measurements made with the transient line heat source method, focusing on phase change materials and direct applications like artificial skin and heat loss from power cables. Explore steady state conductivity measurements, improvements in the method, and testing with gels and liquids. Delve into steady state thermal conductivity, radial test cells, and methods for determining thermal conductivity, discussing the consequences of thermally induced water flow.

Download Presentation

Please find below an Image/Link to download the presentation.
The content on the website is provided AS IS for your information and personal use only. It may not be sold, licensed, or shared on other websites without obtaining consent from the author.If you encounter any issues during the download, it is possible that the publisher has removed the file from their server.
You are allowed to download the files provided on this website for personal or commercial use, subject to the condition that they are used lawfully. All files are the property of their respective owners.
The content on the website is provided AS IS for your information and personal use only. It may not be sold, licensed, or shared on other websites without obtaining consent from the author.
E N D
Presentation Transcript
Mining Applications and Chemometrics www.spectralevolution.com
Incorporated 2004 Full line supplier of UV-VIS-NIR spectrometers for lab, inline process & field portable remote sensing Mfg facility in North Andover , MA OEM manufacturer >100 field portable UV-VIS-NIR instruments in field use worldwide www.spectralevolution.com
Field portable full range UV-VIS-NIR spectrometers & spectroradiometers Laboratory full range UV-VIS-NIR spectrometers & spectroradiometers Single detector InGaAs photodiode array lab spectrometers Single detector Si spectrometers, spectroradiometers & spectrophotometers Light sources & accessories
Spectrometers for mining exploration, mineral identification, and production oreXpress Full range portable spectrometer for mining and mineral identification oreXpress Platinum Also includes a range of FOV lenses, internal battery, membrane control panel for standalone operation, and on-board storage for 1,000 spectra
oreXpress & oreXpress Platinum True field portability <7 lbs Full range UV/VIS/NIR 350-2500nm Fast/High Signal to Noise ratio for better reflectance values Unmatched stability & performance through SWIR2 DARWin SP Data Acquisition software saves scans as ASCII files for use with 3rd party software EZ-ID real-time mineral ID with USGS & SpecMIN libraries
EZ-ID Software with Library Builder Module Real-time mineral identification in the field USGS and SpecMIN libraries Select different spectral regions of interest Compare unknown mineral sample spectra to known library Best match score quickly and automatically displayed
Qualitative & Quantitative Analysis Use EZ-ID for mineral identification and qualitative analysis What is there Use reflectance spectroscopy and chemometrics for quantitative analysis How much is there
Widely used in mining exploration and mineral identification Identification of key alteration minerals associated with potential economic deposits Qualitative mineralogy describes the process of using NIR to quickly ID mineral species during exploration Advanced Argillic Argillic Phyllic Propylitic Potassic
Usage is typically bound by cost (high) and speed (slow) Available examples: Qemscan/MLA Quantitative X-ray diffraction Better solution Quantitative Reflectance Spectroscopy Analyze a greater number of samples in less time, at an affordable cost
Use mineralogical and metallurgical information from a representative set of samples and correlated reflectance spectra to develop statistical calibration models Calibration trains the spectrometer to analyze additional unknown samples Leverage the detailed, more costly analysis of a few samples to analyze a much larger set of related samples
Useful for mining process optimization Real-time or near real-time knowledge of mineralogical and metallurgical properties that impact metal recovery, allows for Intelligent ore sorting Optimization of ore processing Useful for gangue minerology to minimize process cost and increase yield Gangue can affect extractability Talc and hornblende interfere with flotation Carbonates increase acid costs Clays can reduce yield due to loss of heap permeability
oreXpress Mineral Analysis/ Identification www.spectralevolution.com
e 1 Iron Minerals c n Hematite Jarosite Pyroxene Limonite a 0.8 t c e 0.6 l f e 0.4 R 0.2 0 500 1000 1500 2000 2500 Wavelength, nm www.spectralevolution.com
500 1000 1500 2000 2500 1 Calcite Talc Hornblende e c n 0.8 a t c 0.6 e l f e 0.4 R Calcite Talc Hornblende 0.2 0 500 1000 1500 2000 2500 Wavelength, nm www.spectralevolution.com
Clays 0.9 e c 0.8 n a 0.7 t c e 0.6 l f 0.5 e R 0.4 Illite Kaolinite Montmorillonite 0.3 0.2 500 1000 1500 2000 2500 Wavelength, nm www.spectralevolution.com
Advantages of reflectance spectroscopy High throughput Hundreds to thousands of samples per day ideal for rapid blast hole chip analysis Frequent (<1 minute intervals) measurements for in-process sensors Non-contact measurements Simultaneously determine multiple properties
Build, Optimize & Test Model Create Standards Collect Spectra Access Model Measure Unknown Predict Concentrations
Prepare Calibration Set Samples should reflect the physical properties and diversity that will be encountered in the field Analyze the properties of interest using appropriate reference analytical methods, such as: Qemscan X-ray diffraction Acid consumption Other metallurgical tests Measure the reflectance spectra
Things to consider in measuring spectra Features can overlap and may not be from a single component Spectral features in minerals can result from crystal field effects, charge transfer, color centers, and conduction band transitions Spectral features in organic and industrial samples come primarily from CH, NH, OH, and SH bonds Multivariate models can consider all, or a substantial portion of the whole spectrum
Develop and validate your calibration Match each reflectance spectrum you have collected to the corresponding reference analyses Develop calibration equations using multivariate chemometric techniques like partial least-squares regression Validate the performance of the calibration by using an independent set of samples
How to select a reference method NIR is a secondary method the reference needs to be well controlled with the lowest possible error The Standard Error of Laboratory (SEL) should be known and documented If there are changes in the reference method, new reference data may be substantially different from your original data Submission of known samples is a good idea
Things to consider in collecting spectra Verify your system performance using wavelength standards Control particle size, moisture, temperature, and sample packing , or stabilize your model to resist changes in these parameters Use the same sample preparation as optical geometry can affect your outcome
Now apply your calibration Prepare unknown samples with the same method used for calibration samples Measure the reflectance spectrum of the unknown using the same set-up used in building the calibration Apply the calibration to the unknown reflectance spectrum to predict mineralogical and metallurgical properties
How many samples will I need for calibration and test? Reserve 20% of samples for an independent test set 60-90 samples for a feasibility study 120-180 for starting model >180 for a robust production model
How many samples will I need for calibration and validation? Cover the anticipated range of composition Scan in the form that will be analyzed by the model make them match Contain a natural combination of minerals - avoid blending as it can cause problems, beware cross correlations
Ensuring that your model retains its integrity Watch out for samples with high spectral residual and samples that predict at or near the extremes of your model Establish a consistent monitoring program with reference analysis done frequently Implement a plan and schedule for improvement of the model including identifying new samples Establish criteria for revising the model based on time, increased validation error, or similar characteristics
Examples of chemometric analyses using reflectance spectroscopy


 and speed")