The Scientific Method and Investigating Bird Deaths
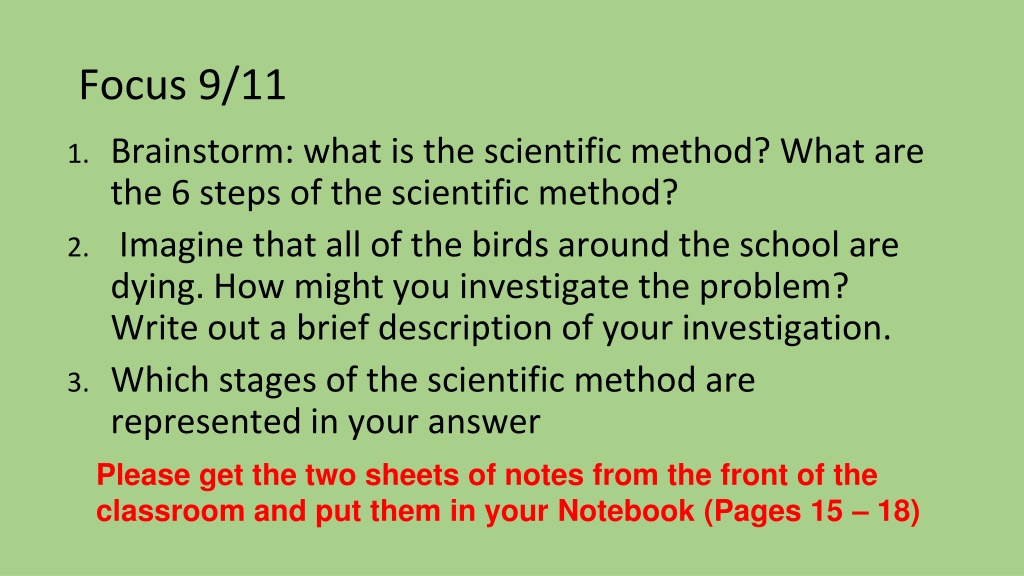

Focus 9/11
1.
Brainstorm: what is the scientific method? What are
the 6 steps of the scientific method?
2.
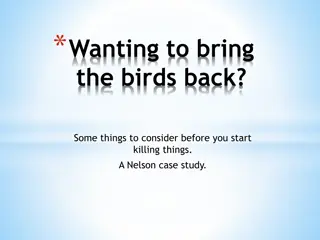
Imagine that all of the birds around the school are
dying. How might you investigate the problem?
Write out a brief description of your investigation.
3.
Which stages of the scientific method are
represented in your answer
P
l
e
a
s
e
g
e
t
t
h
e
t
w
o
s
h
e
e
t
s
o
f
n
o
t
e
s
f
r
o
m
t
h
e
f
r
o
n
t
o
f
t
h
e
c
l
a
s
s
r
o
o
m
a
n
d
p
u
t
t
h
e
m
i
n
y
o
u
r
N
o
t
e
b
o
o
k
(
P
a
g
e
s
1
5
–
1
8
)

Focus 9/17/18
•
Please get an active reading worksheet from the front of
the classroom. Begin working on this as your FOCUS
activity
•
Please get a Mythbusters worksheet from the front of the
classroom. This is classwork. Do not begin working on this
yet.
Objective:
Today I will apply my knowledge of the scientific
method so that I can complete the Mythbusters project. I
know that I have it when I complete the project with a 70%
or better.
Chapter 2
Tools of Environmental Science
Section 1: Scientific Methods
Day 1
The Experimental Method – Scientific
Method
•
Scientists make most of their
discoveries using the
experimental
(scientific) method
.
•
This method consists of a series of
steps that scientists worldwide use
to identify and answer questions
.
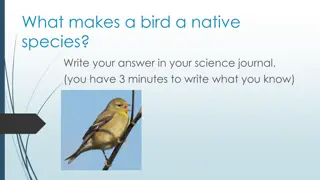
Observing
•
Observation
is the process of obtaining information by using the
senses as well as the information obtained by using the senses.
•
Observing is the
first step
of the experimental method.
•
Observations can take many forms, including
descriptions, drawings,
photographs, and measurements
.
Observing
•
Making Observations
Hypothesizing and Predicting
•
A
hypothesis
is a theory or explanation that is based on
observations and that can be tested.
•
Forming a hypothesis is the
second
step of the experimental
method.
•
A hypothesis is not merely a guess.
•
A good hypothesis should make
logical sense and follow
from what you already know
about the situation.
Hypothesizing and Predicting
•
Predictions
are statements made in advance that
express the results that will be obtained from testing
a hypothesis if the hypothesis is supported.
•
A prediction is used to
test a hypothesis
.
Hypothesizing and Predicting
•
It is important that any hypothesis can be disproved.
•
Every time a hypothesis is disproved, the number of possible
explanations for an observation is
reduced
.
•
By eliminating possible explanations, a scientist can zero in on the
best explanation.
Hypothesizing and Predicting
Experimenting
•
Experiments
are procedures that are carried out under controlled conditions to discover,
demonstrate, or test a fact, theory, or general truth.
•
An experiment is performed when questions that arise from observations
cannot be
answered
with additional observations.
•
Experiments should be designed to pinpoint
cause-and-effect
relationships.
Experimenting
•
Good experiments have two essential characteristics:
a single variable is tested, and a
control is used
.
•
The
variable
is the factor that changes in an experiment in order to test a hypothesis.
•
To test for one variable, scientists usually study
two groups
or situations at one time,
with the variable being the only difference between the two groups.
Experimenting
•
The
experimental group
is the group in the experiment that is
identical to the control group except for one factor and is compared
with controls group.
•
The
control group
is the group in the experiment that serves as a
standard of comparison with another group to which the control
group is identical except for one factor.
Experimenting
•
Paper plane Experiment
•
Example: Keene High School Mussel Experiment
•
Two aquariums
•
Added mussels to both
•
Added phosphate to one aquarium but not the other
Organizing and Analyzing Data
•
Data
is any pieces of information acquired through observation or experimentation.
•
Organizing data into
tables and graphic illustrations helps
scientists analyze the data and
explain the data clearly to others.
•
Graphs are often used by scientists to display relationships or trends in the data.
Organizing and Analyzing Data
•
Bar graphs are useful for comparing the data for several things in one
graph.
Organizing and Analyzing Data
•
Graphing the information makes the trends presented in tables easier
to see.
Drawing Conclusions
•
Scientists determine the results of their experiment by
analyzing their
data and comparing the outcome
of their experiments with their
prediction.
•
Ideally, this comparison provides the scientist with an obvious
conclusion.
Drawing Conclusions
•
However, often the conclusion is not obvious.
•
In these cases, scientists often use
mathematical tools
to help them
determine whether the differences are meaningful or are just a
coincidence.
Repeating Experiments
•
Scientists often repeat their experiments.
•
The more often an experiment can be repeated with the same
results, in different places and by different people, the more sure
scientists become about the reliability of their conclusions.
•
Scientists look for a large amount of supporting evidence before they
accept a hypothesis.
Keys to a good experiment
•
Hypothesis is measurable and repeatable
•
You only change ONE variable – everything else stays the same
•
Experiment is repeated multiple times
Communicating Results
•
Scientists publish their results, sometimes in scientific articles, to share what they have
learned with other scientists.
•
Scientific articles include:
•
the question the scientist explored
•
the reasons why the question is important
•
background information
•
a precise description of how the work was done
•
the data collected
•
the scientist’s interpretation of the data.
The Correlation Method
•
When the use of experiments to answer questions is impossible or
unethical, scientists test predictions by examining correlations.
•
Ex: “What was the earth’s climate like 60 million years ago?”, “Does
smoking cause lung cancer?”
•
Correlation
is the linear dependence between two variables.
The Correlation Method
•
An example is the relative width of a ring on a tree trunk is a good
indicator of the amount of rainfall the tree received in a given year.
•
Trees produce wide rings in rainy years and narrow rings in dry years.
•
This method was used to help scientists investigate why the settlers
at Roanake Island all died and why many died at the Jamestown
Colony.
The Correlation Method
•
The scientists concluded that the settlers may have been the victims
of unfortunate timing.
The Correlation Method
•
Although correlation studies are useful, they do not necessarily prove
cause-and-effect relationships between two variables.
•
Scientists become more sure about their conclusions only if they find
the same correlation in different places and as they continue to
eliminate other possible explanations.
Scientific Habits of Mind
•
Good scientists tend to share several key habits of mind, or ways of approaching and
thinking about things.
•
The first habit of mind is
curiosity
. Good scientists are endlessly curious which drives
them to observe and experiment.
•
The second habit of mind is
skepticism
. This means that good scientists do not believe
everything that they are told.
Scientific Habits of Mind
•
The third habit of mind is
openness to new ideas
. Good scientists
keep an open mind to how the world works.
•
Another habit of mind is
intellectual honesty
. A good scientist is
willing to recognize the results of an experiment even though it may
mean that his or her hypothesis was wrong.
Scientific Habits of Mind
•
Lastly, good scientists share
imagination and creativity
.
•
They are not only open to new ideas, but also able to conceive new
ideas themselves.
•
They have the ability to see patterns where others do not or can
imagine things that others cannot.
•
This allows good scientists to expand the boundaries we know.
Imagination
and
Creativity
•
An example being when John Snow created a spot map which
effectively pinpointed the source of a cholera epidemic in 1854.
YouTube!
Scientific Method Song
Explore the scientific method with its six steps, then delve into an investigation scenario where all birds near a school are dying. Learn how to address such an issue, touching on observing, hypothesizing, experimenting, analyzing data, drawing conclusions, and communicating results.

Download Presentation

Please find below an Image/Link to download the presentation.
The content on the website is provided AS IS for your information and personal use only. It may not be sold, licensed, or shared on other websites without obtaining consent from the author. Download presentation by click this link. If you encounter any issues during the download, it is possible that the publisher has removed the file from their server.
E N D
Presentation Transcript
Focus 9/11 1. Brainstorm: what is the scientific method? What are the 6 steps of the scientific method? 2. Imagine that all of the birds around the school are dying. How might you investigate the problem? Write out a brief description of your investigation. 3. Which stages of the scientific method are represented in your answer Please get the two sheets of notes from the front of the classroom and put them in your Notebook (Pages 15 18)
Focus 9/17/18 Please get an active reading worksheet from the front of the classroom. Begin working on this as your FOCUS activity Please get a Mythbusters worksheet from the front of the classroom. This is classwork. Do not begin working on this yet. Objective: Today I will apply my knowledge of the scientific method so that I can complete the Mythbusters project. I know that I have it when I complete the project with a 70% or better.
Chapter 2 Tools of Environmental Science Section 1: Scientific Methods Day 1
The Experimental Method Scientific Method Scientists make most of their discoveries using the experimental (scientific) method. This method consists of a series of steps that scientists worldwide use to identify and answer questions.
Observing Observation is the process of obtaining information by using the senses as well as the information obtained by using the senses. Observing is the first step of the experimental method. Observations can take many forms, including descriptions, drawings, photographs, and measurements.
Observing Making Observations
Hypothesizing and Predicting A hypothesis is a theory or explanation that is based on observations and that can be tested. Forming a hypothesis is the second step of the experimental method. A hypothesis is not merely a guess. A good hypothesis should make logical sense and follow from what you already know about the situation.
Hypothesizing and Predicting Predictions are statements made in advance that express the results that will be obtained from testing a hypothesis if the hypothesis is supported. A prediction is used to test a hypothesis.
Hypothesizing and Predicting It is important that any hypothesis can be disproved. Every time a hypothesis is disproved, the number of possible explanations for an observation is reduced. By eliminating possible explanations, a scientist can zero in on the best explanation.
Experimenting Experiments are procedures that are carried out under controlled conditions to discover, demonstrate, or test a fact, theory, or general truth. An experiment is performed when questions that arise from observations cannot be answered with additional observations. Experiments should be designed to pinpoint cause-and-effect relationships.
Experimenting Good experiments have two essential characteristics: a single variable is tested, and a control is used. The variable is the factor that changes in an experiment in order to test a hypothesis. To test for one variable, scientists usually study two groups or situations at one time, with the variable being the only difference between the two groups.
Experimenting The experimental group is the group in the experiment that is identical to the control group except for one factor and is compared with controls group. The control group is the group in the experiment that serves as a standard of comparison with another group to which the control group is identical except for one factor.
Experimenting Paper plane Experiment Example: Keene High School Mussel Experiment Two aquariums Added mussels to both Added phosphate to one aquarium but not the other
Organizing and Analyzing Data Data is any pieces of information acquired through observation or experimentation. Organizing data into tables and graphic illustrations helps scientists analyze the data and explain the data clearly to others. Graphs are often used by scientists to display relationships or trends in the data.
Organizing and Analyzing Data Bar graphs are useful for comparing the data for several things in one graph.
Organizing and Analyzing Data Graphing the information makes the trends presented in tables easier to see.
Drawing Conclusions Scientists determine the results of their experiment by analyzing their data and comparing the outcome of their experiments with their prediction. Ideally, this comparison provides the scientist with an obvious conclusion.
Drawing Conclusions However, often the conclusion is not obvious. In these cases, scientists often use mathematical tools to help them determine whether the differences are meaningful or are just a coincidence.
Repeating Experiments Scientists often repeat their experiments. The more often an experiment can be repeated with the same results, in different places and by different people, the more sure scientists become about the reliability of their conclusions. Scientists look for a large amount of supporting evidence before they accept a hypothesis.
Keys to a good experiment Hypothesis is measurable and repeatable You only change ONE variable everything else stays the same Experiment is repeated multiple times
Communicating Results Scientists publish their results, sometimes in scientific articles, to share what they have learned with other scientists. Scientific articles include: the question the scientist explored the reasons why the question is important background information a precise description of how the work was done the data collected the scientist s interpretation of the data.
The Correlation Method When the use of experiments to answer questions is impossible or unethical, scientists test predictions by examining correlations. Ex: What was the earth s climate like 60 million years ago? , Does smoking cause lung cancer? Correlation is the linear dependence between two variables.
The Correlation Method An example is the relative width of a ring on a tree trunk is a good indicator of the amount of rainfall the tree received in a given year. Trees produce wide rings in rainy years and narrow rings in dry years. This method was used to help scientists investigate why the settlers at Roanake Island all died and why many died at the Jamestown Colony.
The Correlation Method The scientists concluded that the settlers may have been the victims of unfortunate timing.
The Correlation Method Although correlation studies are useful, they do not necessarily prove cause-and-effect relationships between two variables. Scientists become more sure about their conclusions only if they find the same correlation in different places and as they continue to eliminate other possible explanations.
Scientific Habits of Mind Good scientists tend to share several key habits of mind, or ways of approaching and thinking about things. The first habit of mind is curiosity. Good scientists are endlessly curious which drives them to observe and experiment. The second habit of mind is skepticism. This means that good scientists do not believe everything that they are told.
Scientific Habits of Mind The third habit of mind is openness to new ideas. Good scientists keep an open mind to how the world works. Another habit of mind is intellectual honesty. A good scientist is willing to recognize the results of an experiment even though it may mean that his or her hypothesis was wrong.
Scientific Habits of Mind Lastly, good scientists share imagination and creativity. They are not only open to new ideas, but also able to conceive new ideas themselves. They have the ability to see patterns where others do not or can imagine things that others cannot. This allows good scientists to expand the boundaries we know.
Imagination and Creativity An example being when John Snow created a spot map which effectively pinpointed the source of a cholera epidemic in 1854.
YouTube! Scientific Method Song