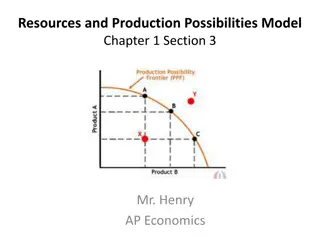
The Costs of Production
The intricacies of production costs in the field of microeconomics with a focus on firm behavior, industry organization, and the impact of competition intensity. Delve into the categories of perfect competition, monopoly, monopolistic competition, and oligopoly, each with varying market structures. Understand the fundamental relationship between production costs and supply curves, illustrated through real-world examples. Gain insights into how businesses set prices and the role of competition in shaping market dynamics.

Download Presentation

Please find below an Image/Link to download the presentation.
The content on the website is provided AS IS for your information and personal use only. It may not be sold, licensed, or shared on other websites without obtaining consent from the author.If you encounter any issues during the download, it is possible that the publisher has removed the file from their server.
You are allowed to download the files provided on this website for personal or commercial use, subject to the condition that they are used lawfully. All files are the property of their respective owners.
The content on the website is provided AS IS for your information and personal use only. It may not be sold, licensed, or shared on other websites without obtaining consent from the author.
E N D
Presentation Transcript
The Costs of Production ECO 10 Introduction to Microeconomics Udayan Roy
Sources: Principles of Microeconomics/Economics by N. Gregory Mankiw Chapter 13: The Costs of Production The whole chapter
Sources: Principles of Microeconomics/Economics by Timothy Taylor Chapter 9: Cost and Industry Structure The whole chapter
Sources: The Economy by The CORE Team Unit 7: The Firm and Its Customers Unit 7.3: Production: The Cost Function for Beautiful Cars
Firm Behavior and the Organization of Industry In this part of the course, we will look at how the functioning of an economy depends on the degree to which businesses can exert control over the prices they set How much freedom a firm has to set its prices depends on the intensity of the competition it faces from other firms This is why the analysis of prices depends on the intensity of competition THE COSTS OF PRODUCTION
Intensity of competition varies from industry to industry Perfect Competition Many firms, all selling the exact same product Monopoly One firm Monopolistic Competition Many firms, all selling the same basic product but with some product differences across firms Oligopoly A small number of firms, selling the same basic product but perhaps with some product differences across firms
A Firms Costs We have seen the theory of supply and demand, which assumes perfect competition We have seen that the supply curve of the theory of supply and demand is constructed from data on production costs Recall the example of the house painters Mary, Frieda, Georgia and Grandma In this chapter, we take a closer look at costs THE COSTS OF PRODUCTION
A Firms Costs A reason to study costs is that the intensity of competition between firms can depend on the relationship between a firm s costs and its level of production In crude terms, if firms costs per unit produced tend to be lower when production levels are higher, existing mega-firms are likely to crush any competition from firms that are new and small THE COSTS OF PRODUCTION
Profit, the firms objective The economic goal of a firm is to maximize its profit. Profit = Total revenue Total cost This assumption like all assumptions is not always true. Firms may have other motives. (But let s keep the discussion simple.)
Profit Maximization Cost Minimization A firm uses various resources various types of labor, capital equipment, raw materials, etc. to produce a commodity There may be numerous ways of combining the various resources to produce a specific quantity of the produced good Rice production in Kansas may rely less on labor and more on land than rice production in Vietnam Profit cannot be maximized unless the firm minimizes costs by choosing the particular mix of the various resources that produces a specific quantity of the produced good at the lowest possible cost
Profit Maximization Cost Minimization As we just saw, a firm minimizes costs by choosing that particular mix of all the various resources so as to produce a specific quantity of the produced good at the lowest possible cost What resource mix the firm will use will depend on the productivity of each resource and its market price A highly productive resource will be heavily used unless its price is disproportionately high A less productive resource will not be heavily used unless its price is disproportionately low
Profit Maximization Cost Minimization In short, how heavily a particular resource is used in production will depend on How productive the resource is, and How expensive it is In other words, the use of the various resources in production depends on The technology (or, production function), and Resource prices
Total Revenue, Total Cost, and Profit Profit = Total Revenue Total Cost Total Revenue The money a firm receives from the sale of its output. It is price times quantity sold. TR = P Q We saw this is in earlier chapters Total Cost The market value of all the inputs (resources) that a firm uses in production. (Again, we assume that the firm chooses the quantities of the various resources so as to minimize costs.)
Explicit and Implicit Costs Total Cost = Explicit Cost + Implicit Cost. Explicit costs are costs that require a direct outlay of money by the firm s owner(s). Implicit costs are costs that do not require an outlay of money by the firm If some of the resources used in production are provided by the owner(s) of the firm, the firm may not have to pay for them. The market value of such resources is the implicit cost. Implicit costs are included in total cost.
Implicit Costs: Examples You own a restaurant and you work eighteen hours a day in it You could have worked elsewhere and earned a wage. This lost income is an implicit cost You have invested $20,000 of your own savings in your restaurant You could have earned interest had you put that money in a bank instead. This lost interest income is an implicit cost THE COSTS OF PRODUCTION
Economic Profit versus Accounting Profit Economic profit = total revenue total cost = total revenue (explicit costs + implicit costs) Accounting profit = total revenue explicit costs As a result, accounting profit > economic profit
Figure 1 Economists versus Accountants How an Economist Views a Firm How an Accountant Views a Firm Economic profit Accounting profit Implicit costs Revenue Revenue Total opportunity costs Explicit costs Explicit costs
Economic Profit and Firm Sustainability Non-negative economic profit is essential for the long-run viability of a firm Caroline s Cookie Factory total revenue = $700 per hour total explicit costs = $650 per hour for labor and raw materials total implicit costs = $110 per hour in wages Caroline could have earned as a computer programmer Accounting profit = $50 per hour. This indicates short-run financial viability Economic profit = $60 per hour. This indicates a dire long-run future. Dissatisfied with the $50 per hour profit, Caroline will eventually shut down the firm and take a programming job THE COSTS OF PRODUCTION
THE VARIOUS MEASURES OF COST Total Cost = fixed cost + variable cost. (Total) Fixed costs are those costs that do not vary with the quantity produced. (Total) Variable costs are those costs that varywith the quantity produced. TC = FC + VC
(Total) Fixed Costs Fixed costs are those costs that do not vary with the quantity produced Factory rent Security costs Marketing costs Research and development costs THE COSTS OF PRODUCTION
(Total) Variable Costs Variable costs are those costs that varywith the quantity produced Cost of raw materials Labor costs THE COSTS OF PRODUCTION
Cost Curves: Total Cost, Variable Cost, and Fixed Cost Cost TC $18.00 16.00 VC 14.00 12.00 10.00 8.00 6.00 4.00 FC 2.00 2 4 6 8 10 12 14 0 Quantity of Output
Average Costs Average cost is also called per-unit cost or, simply, unit cost Average cost can be determined by dividing the firm s total cost by the quantity of output it produces.
Average Costs: Fixed, Variable, and Total FC Q Fixed cost Quantity = = AFC VC Q Variable cost Quantity = = AVC TC Q Total cost Quantity = = ATC
Average Costs: Fixed, Variable, and Total We know that TC = FC + VC Therefore, TC/Q = FC/Q + VC/Q Therefore, ATC = AFC + AVC
A Typical Firms Costs AFC decreases when output increases. AVC and ATC are U-shaped: these costs initially decrease but eventually increase when output increases. Why?
Average Cost Curves: ATC, AVC, and AFC Costs AFC decreases when output increases. AVC and ATC are U-shaped: these costs initially decrease but eventually increase when output increases. Why? $3.00 2.50 2.00 1.50 ATC AVC 1.00 0.50 AFC 0 2 4 6 8 10 12 14 Quantity of Output
Average Cost Curves: ATC, AVC, and AFC Costs Recall that AFC = FC/Q. The numerator (FC) is constant. Therefore, when the denominator (Q) increases, the ratio (fixed cost per unit produced or AFC) naturally decreases. This is why the AFC curve is negatively sloped throughout $3.00 2.50 2.00 1.50 1.00 0.50 AFC 0 2 4 6 8 10 12 14 Quantity of Output
Average Cost Curves: ATC, AVC, and AFC Costs It is assumed that some resources are fixed and others are variable. Moreover, it is assumed that for a given amount of the fixed resources, there is an ideal amount of the variable resources. If the amount of variable resources is too little, the fixed resources cannot be effectively utilized. On the other hand, if the amount of variable resources is too high, there won t be enough of the fixed resource available for the variable resources to be effective. This is why AVC and ATC are U- shaped. $3.00 2.50 2.00 1.50 AVC 1.00 0.50 0 2 4 6 8 10 12 14 Quantity of Output
Marginal Cost Marginal cost (MC) is the increase in total cost (TC) that arises from an additional unit of production. The increase in cost that arises from an extra unit of production is entirely due to the use of additional raw materials and labor Therefore, marginal cost can also be defined as the increase in total variable cost (VC) that arises from an additional unit of production.
Marginal Cost TC Q (change in total cost) (change in quantity) = = MC increase in total variable cost VC = = MC increase production in Q
Average Cost Curves: ATC, AVC, and AFC Costs $3.00 2.50 MC 2.00 1.50 ATC AVC 1.00 0.50 AFC 0 2 4 6 8 10 12 14 Quantity of Output
Typical Cost Curves: Important Properties Marginal cost eventually rises with the quantity of output. The average-total-cost curve is U-shaped. The average-variable-cost curve is U-shaped The marginal-cost curve crosses the average-total-cost curve at the output quantity that minimizes the average total cost. This output is called the efficient scale output The marginal-cost curve crosses the average-variable-cost curve at the output quantity that minimizes the average variable cost.
COSTS IN THE SHORT RUN AND IN THE LONG RUN How much of a firm s total costs are fixed costs and how much are variable costs depends on the time horizon being considered. In the short run, some costs are fixed. In the long run, all costs are variable.
COSTS IN THE SHORT RUN AND IN THE LONG RUN Because some costs are fixed in the short run and variable in the long run, a firm s long-run cost curves differ from its short-run cost curves.
Average Average Total Cost in the Short and Long Run Total Cost in the Short and Long Run Average Total Cost ATC in short run with small factory ATC in short run with medium factory ATC in short run with large factory ATC in long run Quantity of Cars per Day 0
Economies and Diseconomies of Scale Economies of scale exist when long-run average total cost falls as the quantity of output increases. Diseconomies of scale exist when long-run average total cost rises as the quantity of output increases. Constant returns to scale exists when long-run average total cost stays unchanged as the quantity of output increases
Average Average Total Cost in the Short and Long Run Total Cost in the Short and Long Run Average Total Cost ATC in short run with small factory ATC in short run with medium factory ATC in short run with large factory ATC in long run $12,000 10,000 Constant returns to scale Economies of scale Diseconomies of scale Quantity of Cars per Day 0 1,000 1,200
Shifts of the Cost Curves Advances in technology generally reduce costs. Similarly, any decrease in the prices of raw materials and labor usually reduce costs. The various cost curves then shift downwards. A decrease in fixed costs such as factory rent shifts the FC, TC, AFC, and ATC curves downward. But VC, AVC, and MC are unaffected
Any Questions? CHAPTER 10 EXTERNALITIES 42


 Fixed Costs")
 Variable Costs")