The Production Possibilities Model in Economics
The resources and production possibilities model in economics explores scarcity, decision-making processes, factors of production, and the production possibilities frontier. It delves into how societies allocate limited resources to meet unlimited wants, and the balance between resources such as land, capital, labor, and entrepreneurship. The model illustrates trade-offs, opportunity costs, and constraints in production scenarios.

Download Presentation

Please find below an Image/Link to download the presentation.
The content on the website is provided AS IS for your information and personal use only. It may not be sold, licensed, or shared on other websites without obtaining consent from the author.If you encounter any issues during the download, it is possible that the publisher has removed the file from their server.
You are allowed to download the files provided on this website for personal or commercial use, subject to the condition that they are used lawfully. All files are the property of their respective owners.
The content on the website is provided AS IS for your information and personal use only. It may not be sold, licensed, or shared on other websites without obtaining consent from the author.
E N D
Presentation Transcript
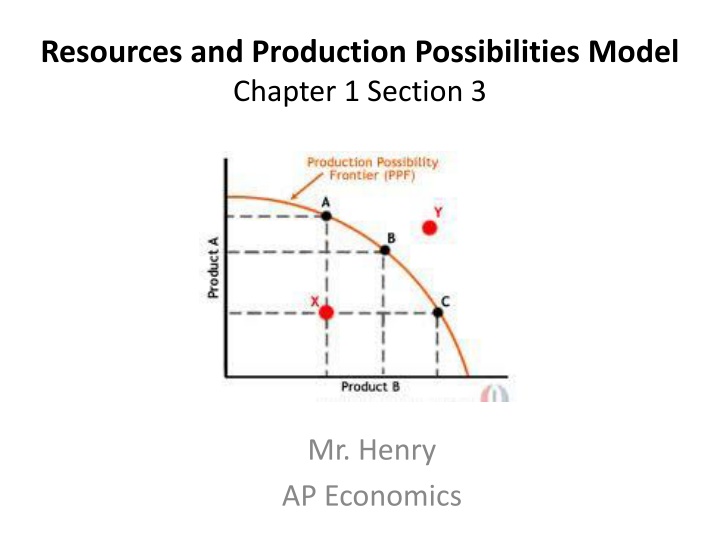
Resources and Production Possibilities Model Chapter 1 Section 3 Mr. Henry AP Economics
Scarcity:Fundamental economic problem of meeting peoples virtually unlimited wants w/ scarce resources How a society decides what to produce using their limited resources because a society cannot have everything How a society determines how to produce an item, whether using people or machines, or both The society must decide who will receive the things produced Within our society, what are examples of choices society must make with its limited resources?
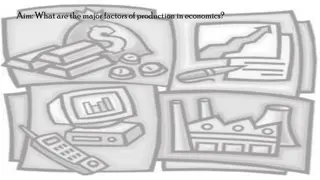
The factors of production, or resources required to produce the goods & services we would like to have, are land, capital, labor, and entrepreneurs. Land: natural resources or other gifts of nature not created by human effort ie arable land, forests, mineral & oil deposits, and water resources Capital: sometimes called capital goods, includes all manufactured aids used in the production of consumer goods and services (factories, storage, transportation, tools, and machinery) Labor: people with all their efforts, abilities, and skills (both physical & mental ie teacher, farmer, physicist) Entrepreneurs: risk-taking individual in search of profits Combines resources of land, labor, and capital
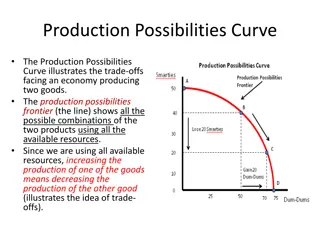
The production possibilities frontier is a diagram representing the maximum combinations of goods and/or services an economy can produce when all productive resources are fully employed. What points on the graph represent maximum combinations of output if all resources are fully employed? What point on the graph would represent if resources are idle, possibly due land/factory not being used, a strike, or possibly a natural disaster? Which point do you think represents production cannot be reached due to no extra resources (such as workers, supplies)? What do you think has to happen if a country is producing at point A but wants to achieve production at point B?
In a production possibilities table, we see the different combinations of two products that can be produced within a specific set of resources, assuming full employment. At any point in time, a fully employed economy must sacrifice some of one good to obtain more of another good. Scarce resources prohibit such an economy from having more of both goods. Society must choose among alternatives! Having more of one thing means having less of something else so there is no such thing as a free puff or free shed!
The data in the production possibilities table are shown graphically as a production possibilities curve. Notice the vertical axis are the crab puffs and the horizontal axis are the storage sheds. This examples shows the law of increasing opportunity costs. As the production of a particular good increases (a shed), the opportunity cost of producing an additional unit increases.
The slope of a line is measured by calculating the change in the value measured on the vertical axis divided by the change in the value measured on the horizontal axis. Another way of saying this is to divide the rise by the run. For the production possibilities curve to the right, this is the change in the quantity of crab puffs (rise) divided by the change in the quantity of storage sheds (run). Here is a handy formula for calculating the slope of the production possibilities curve. Slope = rise/ run (slope = change in crab puffs / change in sheds) For example, the slope of the production possibilities curve between points I (8 sheds and 270 dozen crab puffs) and J (9 sheds and 200 dozen crab puffs) is -70. The rise is a decrease of 70 and the run is an increase of 1. slope, I to J = change in crab puffs / change in sheds = -70 / 1 = -70 270-200 70 ----------- = ----- 8-9 -1
Optimal Allocation Remember Marginal Analysis compares marginal benefits and marginal costs, meaning extra or additional . With the production possibilities curve, we can use the data to try and determine what specific quantities of resources should be allocated to crab puffs and storage sheds in order to maximize satisfaction.
Test Preparation: 1) Using the diagram above, which of the following might have caused the outward movement of the production possibility frontier? A. A decrease in the availability of fertile farmland B. A plague of destructive grasshoppers C. An increase in the productivity of the labor force D. A severe and long-lasting drought E. A decline in the rate of technological improvements C - An increase in the productivity of the labor force
Robots Pizza 10 0 9 100 7 200 4 300 0 400 a. Draw the production possibilities frontier for this economy (put robots on the vertical axis) b. Indicate the area of unattainable production combinations c. Indicate the area of production combinations attainable with some resources employed d. Calculate the per-unit opportunity cost for increasing pizza production from zero to 100 units What you give up You have to give up 10 apples to get 4 oranges 10 5 Opp. Cost = ----------------------- What you gained So for 1 orange you have to give up 2.5 apples! - - - = - - - = 2.5 4 2