Survival Curves

Survival Curves
What do they tell?


1
2
3
4
5
6
7
8
Time

A
B
C
D
E
F


End of accrual
End of study


6 years
2 years
4 years
How can we
describe this
data?
Mean survival+
SD
Median
survival+ range

1
2
3
4
5
6
7
8
Time
A
B
C
D
E
F
End of accrual
End of study
8 years
2 years
4 years
End of study
End of study
Loss to followup
?
How do we describe
How do we describe
this data??
this data??
6 years
4.5 years
5 years
1
2
3
4
5
6
7
8
Time
A
B
C
D
E
F
Reported as Proportion survived at a particular time point
83% at 4 years/ 50% at 5 years
•
All participants have
All participants have
to be followed up till
to be followed up till
the time point.
the time point.
•
Ignores the time of
Ignores the time of
event before or after
event before or after
that particular time
that particular time
point.
point.
Kaplan Meier survival curve
•
Time to event curve is a better
term.
•
Has utility beyond survival
analysis.
•
Time to disease progression
•
Time to drug resistance
•
Time to change in therapy
•
Time to tumor marker elevation
Can be used
•
Where we need to quantify the
time to occurrence of the event.
•
Where event can be defined
clearly.
•
Where all the participants may not
experience the event.
No need to know how to create the plot. Statistical software would do it for us.
But we need to know when to use it and what it means.
Terminologies
•
Event-
•
Outcome of interest
•
well defined, unequivocal eg. Death, progression, relapse
•
Censored-
•
lost to follow up, quit study, no event till end of study period
•
Median time to event
•
Rate of event (at particular time point)
•
Number at risk
•
Effect size
•
P-value
When comparing two or more study arms
The drops are
The drops are
events
events
The dashes on
The dashes on
flat line of plot
flat line of plot
means censored
means censored
Median time to
Median time to
event ~550
event ~550
200 days event
200 days event
rate is 75%
rate is 75%
Kaplan Meier “ESTIMATE”
Kaplan Meier “ESTIMATE”
HR 0.69; 95% CI 0.53-0.89
Comparing curves
•
Hazard ratio
•
Measure of relative effect
•
Uses the whole curve
•
Accounts for time of event
•
Confidence interval
•
The true effect lies between
0.53 and 0.89, 95% of times
•
P- value
•
Log Rank test
•
Cox Proportional Hazard
Study arm - A
Control arm- B
Patil et al Cancer 2019
Different interpretations
of the same curve
•
Hazard ratio
•
Median survival
•
B arm-23 months
•
A arm- not reached
•
Survival at a time point
•
@24 months
•
A- 62%, B-50%
Study arm - A
Control arm- B
C
urves are hugging till 12
months- no benefit
Curves separate after
12 months
Plateau – signifies possible
lasting benefit.
Needs longer followup
•
Absolute benefit ??
•
Clinically significant
benefit?
•
NNT
•
Cost- resources
•
Toxicity
Mok et al NEJM 2009
HR>1
HR<1
HR , CI or p value
alone cannot
adequately explain
this curve.
•
Survival curve is a simple, yet powerful way to express multiple
information about events in a study.
•
We need to look beyond just p- value for proper interpretation of the
data.
•
As clinicians we need to correlate the statistical effects (visual analysis,
HR, CI, p value) and the clinical significance (cost, resource
consumption, toxicity) to translate the data in to clinical practice.
Thank You
•
All participants
•
AOGIN
•
CREDO 2020- Dr Allan Hackshaw
Happy to take questions/ comments…..
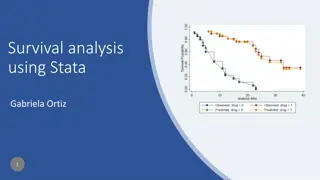
Survival curves provide insights into time-to-event data, such as disease progression or treatment response. Kaplan-Meier analysis is a valuable tool for quantifying event occurrence over time. Learn terminologies, interpretation guidelines, and the significance of censored data in survival analysis.

Download Presentation

Please find below an Image/Link to download the presentation.
The content on the website is provided AS IS for your information and personal use only. It may not be sold, licensed, or shared on other websites without obtaining consent from the author.If you encounter any issues during the download, it is possible that the publisher has removed the file from their server.
You are allowed to download the files provided on this website for personal or commercial use, subject to the condition that they are used lawfully. All files are the property of their respective owners.
The content on the website is provided AS IS for your information and personal use only. It may not be sold, licensed, or shared on other websites without obtaining consent from the author.
E N D
Presentation Transcript
Survival Curves What do they tell?
End of study End of accrual 6 years A How can we describe this data? B C 2 years D Mean survival+ SD E 4 years F Median survival+ range 1 2 3 4 5 6 7 8 Time
End of study End of accrual How do we describe this data?? 6 years A End of study 8 years B 4.5 years ? C 2 years Loss to followup D 5 years E End of study 4 years F 1 2 3 4 5 6 7 8 Time
Reported as Proportion survived at a particular time point 83% at 4 years/ 50% at 5 years A All participants have to be followed up till the time point. B C D Ignores the time of event before or after that particular time point. E F 1 2 3 4 5 6 7 8 Time
Kaplan Meier survival curve Can be used Time to event curve is a better term. Has utility beyond survival analysis. Time to disease progression Time to drug resistance Time to change in therapy Time to tumor marker elevation Where we need to quantify the time to occurrence of the event. Where event can be defined clearly. Where all the participants may not experience the event. No need to know how to create the plot. Statistical software would do it for us. But we need to know when to use it and what it means.
Terminologies Event- Outcome of interest well defined, unequivocal eg. Death, progression, relapse Censored- lost to follow up, quit study, no event till end of study period Median time to event Rate of event (at particular time point) Number at risk Effect size P-value When comparing two or more study arms
The drops are events
The dashes on flat line of plot means censored
Median time to event ~550
200 days event rate is 75%
Comparing curves Study arm - A Hazard ratio Measure of relative effect Uses the whole curve Accounts for time of event Control arm- B HR 0.69; 95% CI 0.53-0.89 Confidence interval The true effect lies between 0.53 and 0.89, 95% of times P- value Log Rank test Cox Proportional Hazard Patil et al Cancer 2019
Different interpretations of the same curve Study arm - A Hazard ratio Control arm- B Median survival B arm-23 months A arm- not reached Survival at a time point @24 months A- 62%, B-50%
Curves are hugging till 12 months- no benefit Curves separate after 12 months Plateau signifies possible lasting benefit. Needs longer followup
Absolute benefit ?? Clinically significant benefit? NNT Cost- resources Toxicity
HR>1 HR , CI or p value alone cannot adequately explain this curve. HR<1 Mok et al NEJM 2009
Survival curve is a simple, yet powerful way to express multiple information about events in a study. We need to look beyond just p- value for proper interpretation of the data. As clinicians we need to correlate the statistical effects (visual analysis, HR, CI, p value) and the clinical significance (cost, resource consumption, toxicity) to translate the data in to clinical practice.
Thank You All participants AOGIN CREDO 2020- Dr Allan Hackshaw Happy to take questions/ comments ..