Indifference Curve, Budget Line, and Consumer Equilibrium


Indifference Curve,
Budget Line
And
Consumer Equilibrium
Dr. Pooja Singh
Assistant Professor,
Department of Economics,
School of Arts ,Humanities And Social Sciences,
Chhatrapati Shahu Ji Maharaj University, Kanpur


Indifference Curve

Based on Ordinal Approach

Explains behaviour of consumer in terms of his
preferences.
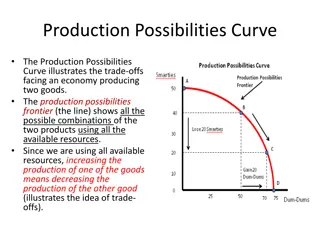
•
Indifference curve may be defined as locus of points, each representing a different combination of two
substitute goods, which yield the same utility or level of satisfaction to the consumer.

Indifference Curve And Budget Line

Dr. Pooja Singh, Assistant Professor, Department of Economics,
School of Arts, Humanities And Social Science,
Chhatrapati Shahu Ji Maharaj University, Kanpur
Indifference Curve And Budget Line
Dr. Pooja Singh, Assistant Professor, Department of Economics,
School of Arts, Humanities And Social Science,
Chhatrapati Shahu Ji Maharaj University, Kanpur
Indifference Curve
Indifference Map
Indifference curve is derived from indifference schedule
.
Properties Of Indifference Curve
Negatively sloping
Convex to origin
Neither intersect nor be tangent with one another
Higher the indifference curve represent a higher
level of satisfaction.
Indifference Curve And Budget Line
Dr. Pooja Singh, Assistant Professor, Department of Economics,
School of Arts, Humanities And Social Science,
Chhatrapati Shahu Ji Maharaj University, Kanpur
Budget Line
•
A budget line shows all possible combination of two commodities that could be pursued
with a given amount of income.
•
straight line that slope downwards
•
The budget line, also known as the budget constrain
•
The equation of the budget line equation can be represented as follows
:
M = Px × Qx + Py × Qy
•
Where,
Px = cost of product X.
Qx
=
the quantity of product X.
Py
=
cost of product Y.
Qy = quantity of product Y.
M = consumer’s income.
Indifference Curve And Budget Line
Dr. Pooja Singh, Assistant Professor, Department of Economics,
School of Arts, Humanities And Social Science,
Chhatrapati Shahu Ji Maharaj University, Kanpur
Indifference Curve And Budget Line
Dr. Pooja Singh, Assistant Professor, Department of Economics,
School of Arts, Humanities And Social Science,
Chhatrapati Shahu Ji Maharaj University, Kanpur
Change in budget line
•
1. Change in income
•
2. Change in price-
Indifference Curve And Budget Line
Dr. Pooja Singh, Assistant Professor, Department of Economics,
School of Arts, Humanities And Social Science,
Chhatrapati Shahu Ji Maharaj University, Kanpur
Increase lead to parallel outward shift
Increase in price of goods X rotate the
line clockwise.
A decrease in price of goods X rotate the
line counter clockwise.
Decrease lead to parallel inward shift
Consumer Equilibrium
Rational consumer choose the highest
indifference curve given the budget constraint
At the point of tangency, the slope of indifference
curve and budget line are equal is the Consumer
Equilibrium
References
•
Dwivedi D N, Managerial Economics, Vikas Publishing House Pvt. Ltd, 2006
Indifference curves and budget lines are essential concepts in economics to analyze consumer behavior and preferences. Dr. Pooja Singh, an Assistant Professor at Chhatrapati Shahu Ji Maharaj University, Kanpur, explains how indifference curves represent different combinations of goods that offer the same level of satisfaction to consumers. Budget lines depict affordable commodity combinations based on income and prices. Through these graphical tools, economists can determine consumer equilibrium where preferences align with budget constraints. Explore the properties and implications of indifference curves and budget lines to gain insight into consumer decision-making.

Download Presentation

Please find below an Image/Link to download the presentation.
The content on the website is provided AS IS for your information and personal use only. It may not be sold, licensed, or shared on other websites without obtaining consent from the author. Download presentation by click this link. If you encounter any issues during the download, it is possible that the publisher has removed the file from their server.
E N D
Presentation Transcript
Indifference Curve, Budget Line And Consumer Equilibrium Dr. Pooja Singh Assistant Professor, Department of Economics, School of Arts ,Humanities And Social Sciences, Chhatrapati Shahu Ji Maharaj University, Kanpur
Indifference Curve And Budget Line Indifference Curve Based on Ordinal Approach Explains behaviour of consumer in terms of his preferences. Indifference curve may be defined as locus of points, each representing a different combination of two substitute goods, which yield the same utility or level of satisfaction to the consumer. Dr. Pooja Singh, Assistant Professor, Department of Economics, School of Arts, Humanities And Social Science, Chhatrapati Shahu Ji Maharaj University, Kanpur
Indifference Curve And Budget Line Indifference curve is derived from indifference schedule. Combination Units of Y Units of X Total Utility A 25 3 U B 15 6 U C 8 9 U D 4 12 U E 2 15 U 30 25 20 15 10 5 0 0 5 10 15 20 Indifference Curve Indifference Map Dr. Pooja Singh, Assistant Professor, Department of Economics, School of Arts, Humanities And Social Science, Chhatrapati Shahu Ji Maharaj University, Kanpur
Indifference Curve And Budget Line Properties Of Indifference Curve Negatively sloping Neither intersect nor be tangent with one another Higher the indifference curve represent a higher level of satisfaction. Convex to origin Dr. Pooja Singh, Assistant Professor, Department of Economics, School of Arts, Humanities And Social Science, Chhatrapati Shahu Ji Maharaj University, Kanpur
Indifference Curve And Budget Line Budget Line A budget line shows all possible combination of two commodities that could be pursued with a given amount of income. straight line that slope downwards The budget line, also known as the budget constrain The equation of the budget line equation can be represented as follows: M = Px Qx + Py Qy Where, Px = cost of product X. Qx = the quantity of product X. Py = cost of product Y. Qy = quantity of product Y. M = consumer s income. Dr. Pooja Singh, Assistant Professor, Department of Economics, School of Arts, Humanities And Social Science, Chhatrapati Shahu Ji Maharaj University, Kanpur
Indifference Curve And Budget Line 12 Budget schedule Combination Cream biscuit (@ 10 per packet) Plain biscuit (@ 5 per packet) Budget allocation 10 A 0 10 10 0 + 5 10 = 50 8 Plain Biscuit B 1 8 10 1 + 5 8 = 50 6 C 2 6 10 2 + 5 6 = 50 4 D 3 4 10 3 + 5 4 = 50 E 4 2 10 4 + 5 2 = 50 2 F 5 0 10 5 + 5 0 = 50 0 0 1 2 3 4 5 6 Cream Biscuit Dr. Pooja Singh, Assistant Professor, Department of Economics, School of Arts, Humanities And Social Science, Chhatrapati Shahu Ji Maharaj University, Kanpur
Indifference Curve And Budget Line Change in budget line 1. Change in income Increase lead to parallel outward shift Decrease lead to parallel inward shift 2. Change in price- A decrease in price of goods X rotate the line counter clockwise. Increase in price of goods X rotate the line clockwise. Dr. Pooja Singh, Assistant Professor, Department of Economics, School of Arts, Humanities And Social Science, Chhatrapati Shahu Ji Maharaj University, Kanpur
Consumer Equilibrium Rational consumer choose the highest indifference curve given the budget constraint At the point of tangency, the slope of indifference curve and budget line are equal is the Consumer Equilibrium
References Dwivedi D N, Managerial Economics, Vikas Publishing House Pvt. Ltd, 2006