Study on Wave Climate in Go Cong and U Minh Regions
This study focuses on analyzing the wave climate in Go Cong and U Minh areas in Vietnam using the Telemac-Tomawac wave model. The research covers the simulation of wind-wave characteristics in the East Sea and West South Sea over a 3-year period. Data input, model setup, calibration, and computed domains are detailed, providing insights into the wave behavior in these coastal regions.
Download Presentation

Please find below an Image/Link to download the presentation.
The content on the website is provided AS IS for your information and personal use only. It may not be sold, licensed, or shared on other websites without obtaining consent from the author.If you encounter any issues during the download, it is possible that the publisher has removed the file from their server.
You are allowed to download the files provided on this website for personal or commercial use, subject to the condition that they are used lawfully. All files are the property of their respective owners.
The content on the website is provided AS IS for your information and personal use only. It may not be sold, licensed, or shared on other websites without obtaining consent from the author.
E N D
Presentation Transcript
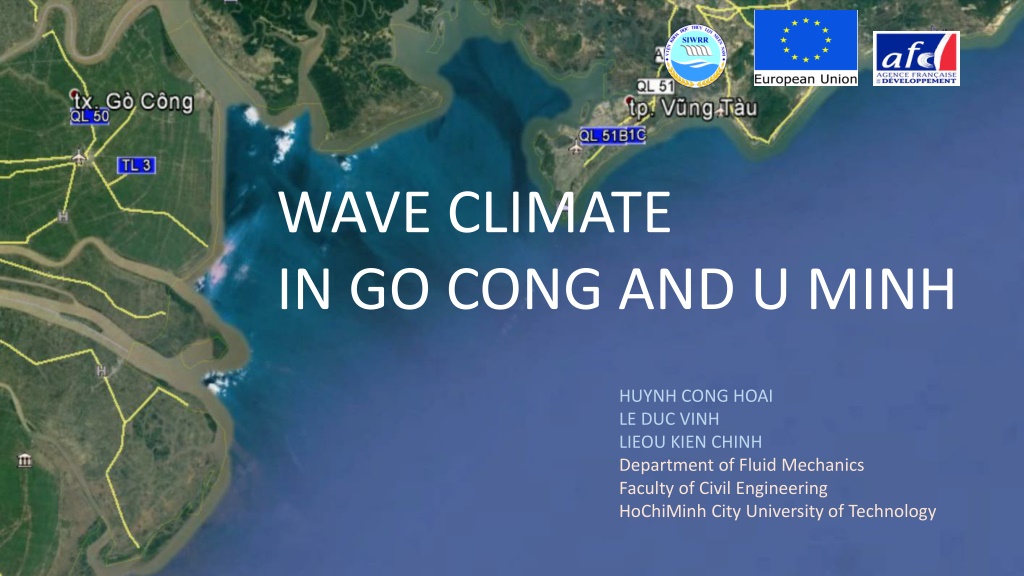
WAVE CLIMATE IN GO CONG AND U MINH HUYNH CONG HOAI LE DUC VINH LIEOU KIEN CHINH Department of Fluid Mechanics Faculty of Civil Engineering HoChiMinh City University of Technology
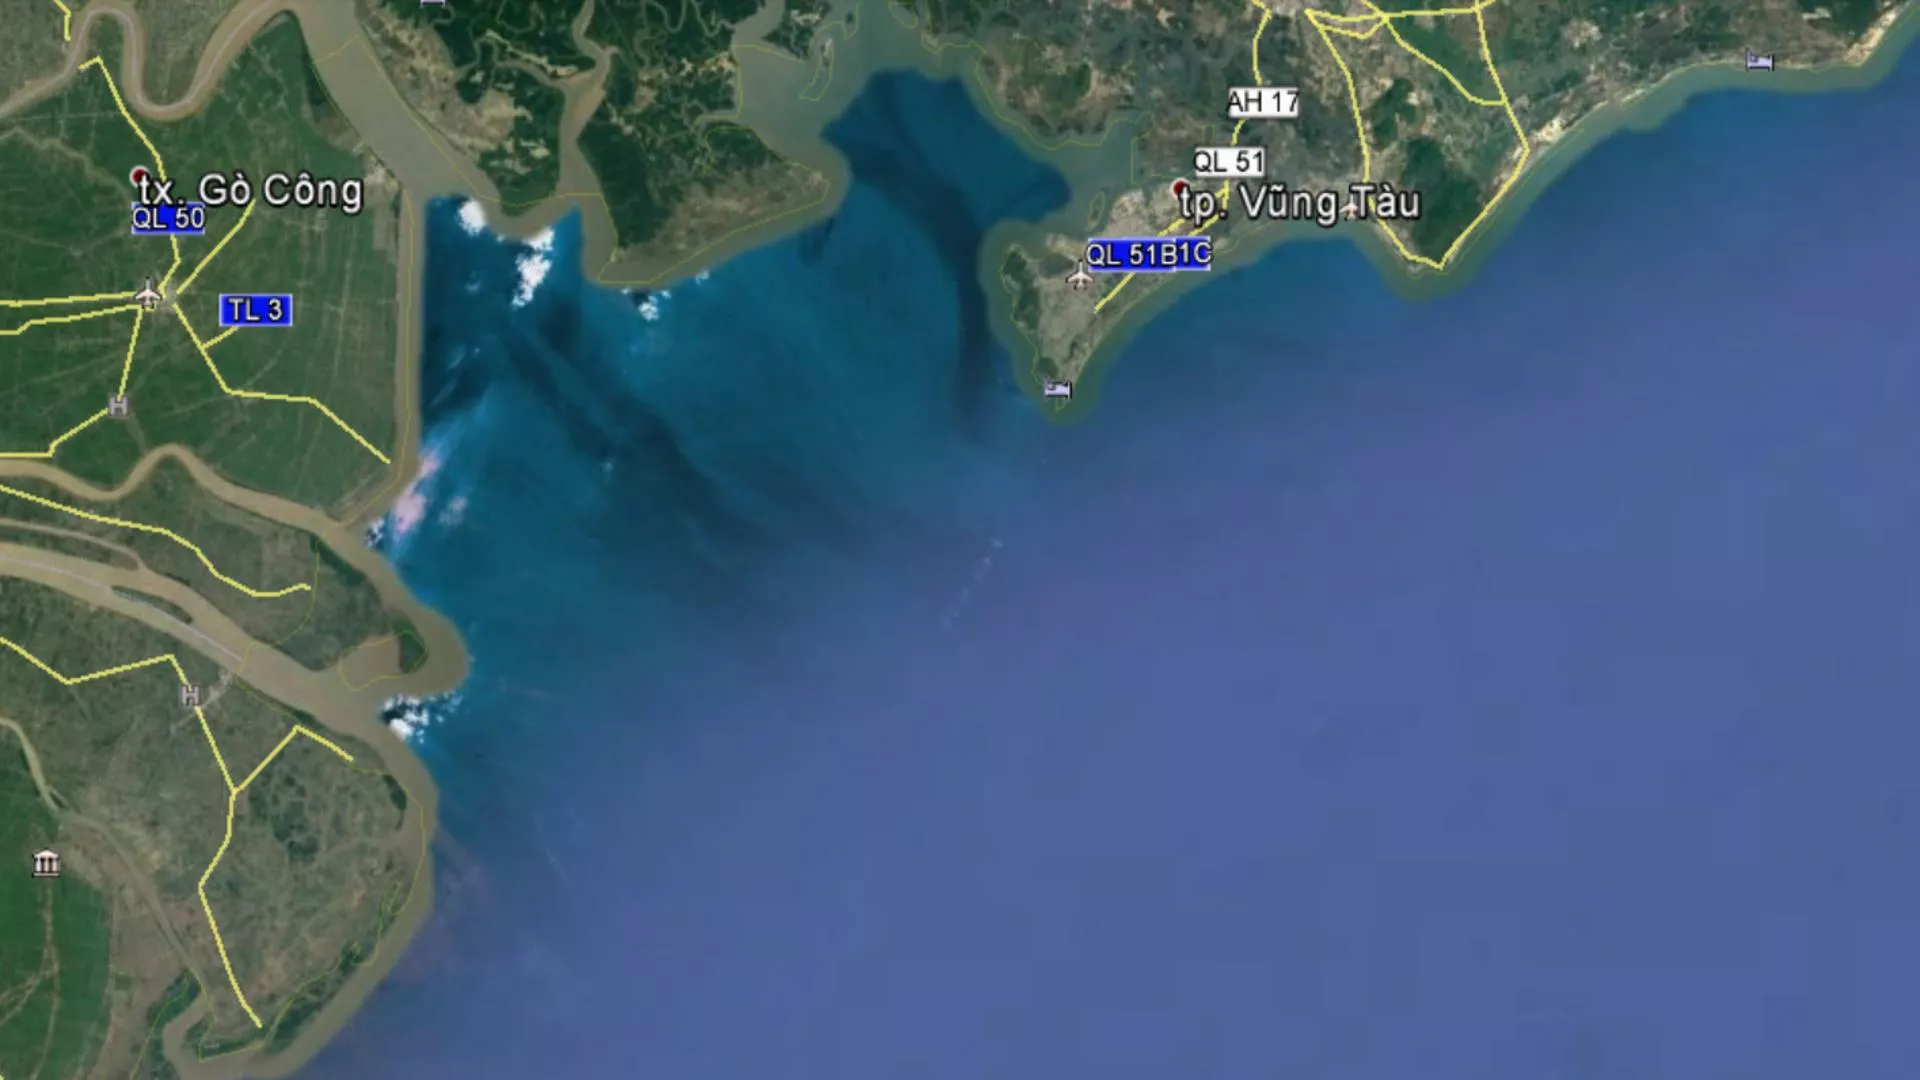
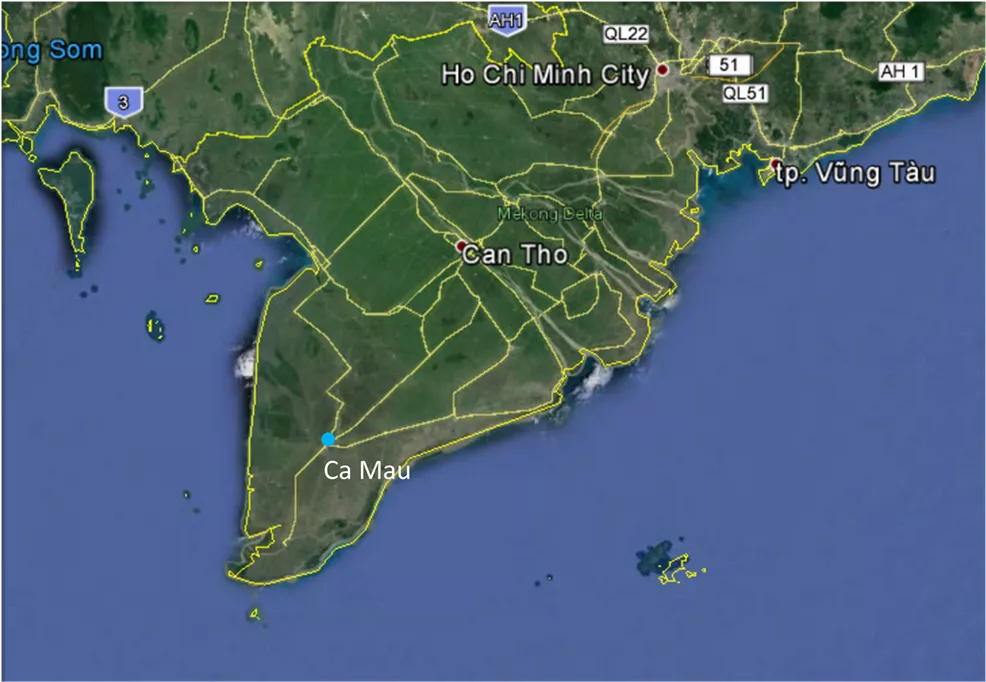
STUDY AREA GO CONG - Go Cong in the Mekong delta , South of Vietnam - Go Cong coast faces the east sea - Go Cong is far from HCM City about 60 km as crow flies. GO CONG U MINH - U Minh in the Mekong delta , South of Vietnam - U Minh coast faces the West- south sea of Vietnam - U Minh is far from HCM City about 270 km as crow flies. U MINH East sea Ca Mau West South sea Fig.1 Location of Go Cong and U Minh
METHODOLOGY - Wave models Telemac -Tomawac was applied to simulate the wind - wave in East sea and in West South sea of Vietnam - Period of simulation is 3 years: 2014 2015 - 2016 - 2 points in Go Cong Coast (GC1, GC4) and 2 point in U Minh ( UM2, UM4) were selected to analyze the characteristics of wave Fig.2 Location of 2 selected points in Go Cong Fig.3 Location of 2 selected points in U Minh
MODEL SETUP AND CALIBRATION MODEL SETUP China DATA INPUT Bathymetry : Taiwan - Bathymetry data of East-sea and West South sea were collected from GEBCO (General Bathymetric Chart of Ocean) published in 2014 with the global 30 arc-second (925m) interval grid Thailand East sea - Bathymetry data of study area (Go Cong and U Minh ) was surveyed by LMDCZ project (2016) West South sea Go Cong U Minh Wind data : - Wind field data in East sea and West South sea were collected from NOAA with the global 30 arc-second (925m) interval grid Fig.4 Computed domain
MODEL SETUP AND CALIBRATION China COMPUTED DOMAIN Go Cong : Taiwan - Cover East sea and West South sea of Vietnam - Coarse grid with the interval of 40 Km for whole region Thailand - Number of node : 11263 - Fine grid with the interval of 500 m for study area Go Cong - Number of element : 21642 - Computing time : 3,5 days for one years simulation Fig.5 Computed domain and grid for Go Cong
MODEL SETUP AND CALIBRATION China COMPUTED DOMAIN U Minh: Taiwan - Cover a partly East sea and in West South sea of Vietnam - Coarse grid with the interval of 40 Km for whole region - Fine grid with the interval of 500 m for study area Thailand - Number of node : 6369 U Minh - Number of element : 12111 - Computing time : 1,2 days for one years simulation Fig.6 Computed domain and grid for U Minh
MODEL SETUP AND CALIBRATION CALIBRATION Calibration with the observed data - 2 points GCO1, UMO1, in Go Cong and U Minh were used to compare with the observed wave data Coordinate of observed point: GCO1 (106.880062 , 10.268189 ) UMO1 (104.677830 , 9.314954 ) GCO1 - Period for calibration : Go Cong: 16 days, from 16th Oct. to 31th Oct, 2016. U MInh 9 days, from 16th Oct. to 25th Oct, 2016. UMO1 Fig.7 : Location of 2 points to calibrate with the observed data
MODEL SETUP AND CALIBRATION Comparison between computed and observed wave height at Go Cong Error Index: Error Index Mean error (ME) 0,055 Root mean square error (RMSE) 0,235 Standard deviation of error (SD) 0,228 Scatter index (SI) 0,558 Fig. 8: Comparison between computed and observed wave height at point GCO1 from 16/10 - 31/10/2016
MODEL SETUP AND CALIBRATION Comparison between computed and observed wave height at U Minh Error Index: Error Index Mean error (ME) 0,055 Root mean square error (RMSE) 0,236 Standard deviation of error (SD) 0,229 Scatter index (SI) 0,270 Fig.9 Comparison between computed and observed wave height at point UMO1 from 16/10 - 24/10/2016
WAVE ANALYSIS IN GO CONG The selected locations to analyze the characteristic of waves - 2 points (GC1, GC4) were selected - GC1 locates in study area Study area 8,5 km - GC4 locates in off shore of study area 22 km Fig.10 Location of points GC1 and GC4
WAVE ANALYSIS IN GO CONG Direction of shoreline Wave rose at point GC4 in Go Cong 22 km Direction of shoreline Location of point GC4 Fig.11 Wave rose at point GC4 in Go Cong
WAVE ANALYSIS IN GO CONG Wave rose at GC4 varies with the months Sep Jul Apr Aug May Jun Fig. 12 Wave rose in summer Nov Oct Dec Jan Mar Feb Fig.13 Wave rose in monsoon Dominate wave direction in Go Cong at CG4 - In summer : WS - In monsoon: ENE
WAVE ANALYSIS IN GO CONG Direction of shoreline Wave rose at point GC1 in Go Cong 8,5 km Direction of shoreline Location of point CG1 Fig.14 : Wave rose at point GC1 in Go Cong
WAVE ANALYSIS IN GO CONG Wave rose at GC1 varies with the months Sep Jul Aug Jun Apr May Fig.15: Wave rose in summer Nov Oct Dec Mar Jan Feb Fig.16: Wave rose in monsoon Dominate wave direction in Go Cong - In summer : S - SWS - In monsoon: E
WAVE HEIGHT ANALYSIS IN GO CONG Probability of wave height GC4 GC1 Fig.17a: Probability of wave height in Go Cong (GC1, GC4)
WAVE HEIGHT ANALYSIS IN GO CONG Probability of Wave height in onshore and offshore at Go Cong GC6 1,5 km 8,5 km GC1 Fig.17b: Probability of wave height varies with years in Go Cong (GC1, GC4)
WAVE HEIGHT ANALYSIS IN GO CONG Probability of wave height varies with the years GC4 GC1 Fig.17b: Probability of wave height varies with years in Go Cong (GC1, GC4)
WAVE DIRECTION ANALYSIS IN GO CONG Probability of wave direction 45.00 GC4 38.71 40.00 35.00 30.00 25.00 22.95 P(%) 20.00 15.00 12.40 10.94 10.00 5.31 3.42 5.00 2.67 1.45 1.42 0.28 0.16 0.15 0.06 0.05 0.02 0.02 0.00 Direction GC1 50.00 46.34 40.00 30.00 P(%) 21.25 20.00 Fig.18: Probability of wave direction in Go Cong (GC1, GC4) 16.30 8.22 10.00 3.18 2.58 1.13 0.52 0.25 0.07 0.06 0.05 0.03 0.01 0.00 0.00 0.00 Direction
WAVE ANALYSIS IN U MINH Wave rose at point UM2 in U Minh Direction of shoreline 18km Location of point UM2 and UM4 Direction of shoreline Fig.21 : Wave rose at point UM2 in U MInh
WAVE ANALYSIS IN U MINH Wave rose at UM2 varies with the months Sep Jul Apr Aug May Jun Fig.22: Wave rose in summer Nov Oct Dec Mar Jan Feb Fig.23: Wave rose in monsoon Dominate wave direction in U Minh at UM2 - In summer : W - WSW - In monsoon: ENE - E
WAVE ANALYSIS IN U MINH Wave rose at point UM4 in U Minh Direction of shoreline 18km Location of point UM2 and UM4 Direction of shoreline Fig.24 : Wave rose at point UM4 in U MInh
WAVE ANALYSIS IN U MINH Wave rose at UM4 varies with the months Sep Jul Apr Aug May Jun Fig.25 Wave rose in summer Nov Oct Dec Mar Jan Feb Fig.26 Wave rose in monsoon Dominate wave direction in U Minh at UM4 - In summer : Changing from W to S - In monsoon: ENE - E
WAVE HEIGHT ANALYSIS U MINH Probability of wave height UM2 UM4 Fig.27a: Probability of wave height in U Minh (UM2, UM4)
WAVE HEIGHT ANALYSIS U MINH Probability of wave height on offshore and on shore UM6 18km 2km UM2 Fig.27a: Probability of wave height in U Minh (UM2, UM4)
WAVE HEIGHT ANALYSIS U MINH UM2 Probability of wave height varies with the years UM4 Fig.27b: Probability of wave height varies with the years in U Minh (UM2, UM4)
WAVE DIRECTION ANALYSIS IN U MINH UM2 Probability of wave direction 18.00 15.30 16.00 14.00 12.60 11.99 12.00 11.18 10.00 8.94 P(%) 7.28 8.00 6.40 6.19 5.94 6.00 4.03 3.33 4.00 2.78 2.78 2.00 0.71 0.35 0.22 0.00 UM4 Direction 18.00 16.00 15.04 14.78 14.00 11.52 12.00 10.70 10.00 P(%) 8.30 7.66 Fig.28: Probability of wave direction in U Minh (UM2, UM4) 8.00 6.76 5.48 6.00 5.05 5.02 3.66 3.65 4.00 1.13 2.00 0.60 0.43 0.23 0.00 Direction
SUMMARY GO CONG U MINH Wave height : 0.5 m 1m P% = 28,1 % 1.0 m 1.5m P% = 18,8 % 0.5 m 1m P% = 33,7 % 1.0 m 1.5m P% = 5,9 % Wave Direction : ENE-E-WSW-W P% = 10% - 15% ENE P% = 38% SW P% = 22.95% Wave Period : T 5 8 s T 5 7 s
