Impacts of Climate Change on Shoreline Dynamics in Southeast Queensland, Australia
The study focuses on understanding the influence of climate phenomena like ENSO, SAM, and STR on shoreline change along the wave-dominated coast of Southeast Queensland. Utilizing a shoreline dataset mapped over two decades, the research explores the variability in wave climate and its correlation with ENSO phases. Insights from the study area at Rainbow Beach provide essential information on shoreline dynamics affected by factors like tidal corrections and longshore transport systems.

Download Presentation

Please find below an Image/Link to download the presentation.
The content on the website is provided AS IS for your information and personal use only. It may not be sold, licensed, or shared on other websites without obtaining consent from the author.If you encounter any issues during the download, it is possible that the publisher has removed the file from their server.
You are allowed to download the files provided on this website for personal or commercial use, subject to the condition that they are used lawfully. All files are the property of their respective owners.
The content on the website is provided AS IS for your information and personal use only. It may not be sold, licensed, or shared on other websites without obtaining consent from the author.
E N D
Presentation Transcript
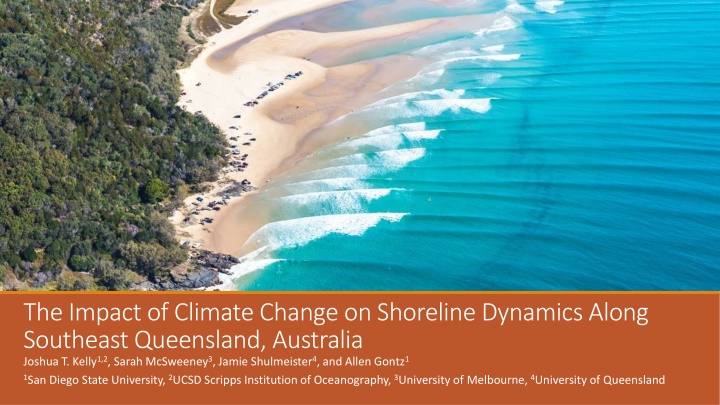
The Impact of Climate Change on Shoreline Dynamics Along Southeast Queensland, Australia Joshua T. Kelly1,2, Sarah McSweeney3, Jamie Shulmeister4, and Allen Gontz1 1San Diego State University, 2UCSD Scripps Institution of Oceanography, 3University of Melbourne, 4University of Queensland
Motivation Variability in wave climate expected to be dominant process influencing shoreline change along exposed, sandy coastlines (i.e. Australia, Brazil, North Carolina)(Hemer et al., 2012) For southeast Australia, wave climate has been well correlated to phases of El Ni o-Southern Oscillation (ENSO; Ranasinghe et al., 2004; McSweeney and Shulmeister, 2018) Where ENSO operates in tropical latitudes, wave climate of SE AU is likely influenced by other climate phenomena operating in the region such as: Southern Annular Mode (SAM; Goodwin, 2005) Subtropical Ridge (STR; Hemer et al., 2013) There have been no attempts at understanding the relative influence of ENSO, SAM, and STR on shoreline change in SEQLD, or in SE AU in general.
Study Area Rainbow Beach, Cooloola Sand Mass, SEQLD 1 km stretch Wave-dominated, micro-tidal Shoreline supplied by an extensive, 1,100 km long longshore transport system that originates in New South Wales (transports 500,000 m3/yr of sand, Walker et al., 2018) Sediment is sourced from the Hawkesbury Sandstone Ultra mature - 98% Quartz/2% heavy minerals and feldspar (Thompson, 1983)
Ranasinghe et al., 2004 Goodwin, 2005 McSweeney and Shulmeister, 2018 La Ni a (higher Hs) Positive SAM Drosdowsky, 2005 Subtropical Ridge Latitude Range El Ni o (lower Hs) Negative SAM
Shoreline Dataset Shorelines mapped on 147 cloud-free Landsat 5, 7, and 8 scenes from 1996 to 2017 Shoreline interpreted as the boundary of water and non-water pixels determined by the Modified Normalized Difference Water Index (MNDWI, Xu 2006) USGS Digital Shoreline Analysis System (Thieler et al., 2009) used to calculate rate-of-change statistics on the shoreline vector data Shoreline distance measured at 20 transects and averaged to construct a change curve
Tidal Correction Significant horizontal offsets due to variable tide stages at the time of Landsat flyover Width of intertidal zone estimated using 1 m LiDAR dataset: Width = Vertical Tide Range/sin(Beach Slope) = 31.5 m Difference between Landsat flyover tide height and high tide height provides % of total tide range shoreline has moved Absolute distance the shoreline has moved due to tides is 31.5 m * % tide range (100% is low tide)
Climate Data Monthly mean Southern Oscillation Index (SOI) from NOAA Monthly mean Southern Annular Mode (SAM) from NWS NCEP/NCAR Reanalysis Mean Sea Level Pressure from NOAA The L Index of Drosdowsky, 2005 describes the latitudinal position of the STR no public dataset Reconstructed here using the MSLP data Location (STR-L) and intensity of the peak (STR-P) MSLP over the 150 E band extracted for 264 time slices Location of STR in May 2017
Correlation Procedure 3-month moving average filter applied to SOI, SAM, STR-L, and STR-P datasets Climate time series datasets (n=264) interpolated to match sample size of shoreline position time series (n = 147) Pearson correlation analyses performed on tidally-corrected shoreline distances and the four climate datasets Correlation coefficient function in Matlab R2017b returns matrix of correlation coefficients, p- values, and lower and upper bounds for a 95% Confidence Interval
Results SOI (R = -0.14) and SAM (R = -0.19) both show negative correlation with shoreline change Shoreline retreats (progrades) during both positive (negative) SOI and SAM phases Relatively low Pearson coefficient values attributed to noise of shoreline dataset STR-L and STR-P show no observed correlation
Shoreline Change and SAM Very recent work has suggested SAM influences wave climate along the QLD coast (Marshall et al., 2018) Marshall et al. (2018) show there is a 0.1-0.2 m increase in significant wave height during positive SAM phases, largest impact in austral winter (JJA) Of 31 episodes of significant erosion (>10 m) detected, 20 occurred during or within 2 months of austral winter We suggest for the first time that SAM has a likely influence on shoreline dynamics along the SEQLD coast
Future Climate Implications Negative correlation between SOI/SAM and shoreline positions provides valuable insight into how the study area (and other similar AU shorelines) may respond to future predicted climate changes Climate Index Predicted Change Wave climate impacts in SE AU Shoreline impacts (based on this work) Southern Annular Mode Continue to become more positive (Arblaster et al., 2011; Hemer et al., 2010) Increased wave energy flux due to enhanced northward propagating swell Shoreline retreat El Ni o- Southern Oscillation Continuous rise in global T will promote stronger La Ni a anomalies (L Heureux et al., 2013) Frequency of extreme La Ni a events expected to increase 56% (Cai et al., 2015) More La Ni a-like wave climate: easterly wave incident wave direction and elevated sig. wave heights up to 0.1 m (McSweeney and Shulmeister, 2018) Shoreline retreat
Acknowledgements Support: Allen Gontz, San Diego State University Sarah McSweeney, The University of Melbourne Jamie Shulmeister, The University of Queensland Funding: San Diego State University, Geological Society of America Data: USGS, NOAA, NWS, Queensland Government
Thank you for your attention Barnard P.L., Short A.D., Harley M.D., Splinter K., Vitousek S., Turner I., Allan J., Banno M., Bryan K., Doria A., Hansen J., Kato S., Kuriyama Y., Randall-Goodwin E., Ruggiero P., Walker P., Heathfield D., 2015. Coastal vulnerability across the Pacific dominated by El Ni o/Southern Oscillation. Nat. Geosci. 8, 801-807. Drosdowsky, W., 2005b. The latitude of the subtropical ridge over Eastern Australia: TheL index revisited. Int. J. Climatol. 25, 1291 1299 Goodwin, I. D., 2005. A mid-shelf, mean wave direction climatology for Southeastern Australia, and its relationship to the El Ni o-Southern Oscillation since 1878 A.D. Int. J. Climatol. 25, 1715-1729. Hemer, M.A., McInnes, K.L., Ranasinghe, R., 2012. Climate and variability bias adjustment of climate model-derived winds for a southeast Australian dynamical wave model. Ocean Dyn. 62, 87 104. Marshall, A.G., Hemer, M.A., Hendon, H.H., McInnes, K.L., 2018. Southern Annular Mode impacts on global ocean surface waves. Ocean Model. 129, 58-74. McSweeney, S., Shulmeister, J., 2018. Variations in wave climate as a driver of decadal scale shoreline change at the Inskip Peninsula, southeast Queensland, Australia. Estuar. Coast. Shelf Sci. 209, 56-69. Ranasinghe, R., McLoughlin, R., Short, A., Symonds, G., 2004. The Southern Oscillation Index, wave climate, and beach rotation. Mar. Geol. 204, 273-287. Thieler, E.R., Himmelstoss, E. A., Zichichi, J. L., Ergul, A., 2017. Digital Shoreline Analysis System (DSAS) version 4.0 - An ArcGIS extension for calculating shoreline change (ver. 4.4, July 2017): U.S Geological Survey Open-File Report 2008-1278, https://pubs.er.usgs.gov/publication/ofr20081278 Thompson, C., 1983. Development and weathering of large parabolic dune systems along the subtropical coast of eastern Australia. Zeitschrift fur Geomorphologie, Supplementband. 45, 205 225. Walker, J., Lees, B., Olley, J., Thompson, C., 2018. Dating the Cooloola coastal dunes of South-Eastern Queensland, Australia. Mar. Geol. 398, 73 85. Xu, H., 2006. Modification of normalised difference water index (NDWI) to enhance open water features in remotely sensed imagery. Int. J. Remote Sens. 27, 3025-3033.