State Health Care Affordability Analysis 2023
The Peterson-Milbank Program, in collaboration with Manatt Health, has developed Data Analytic Resources to assist states in leveraging health care data for informed decision-making. The provided sample slides offer customizable insights on national and state health care spending trends. By utilizing the accompanying Databook, states can tailor the data visuals to their specific needs. Accessible resources aim to enhance market understanding and guide policy actions.
Download Presentation

Please find below an Image/Link to download the presentation.
The content on the website is provided AS IS for your information and personal use only. It may not be sold, licensed, or shared on other websites without obtaining consent from the author.If you encounter any issues during the download, it is possible that the publisher has removed the file from their server.
You are allowed to download the files provided on this website for personal or commercial use, subject to the condition that they are used lawfully. All files are the property of their respective owners.
The content on the website is provided AS IS for your information and personal use only. It may not be sold, licensed, or shared on other websites without obtaining consent from the author.
E N D
Presentation Transcript
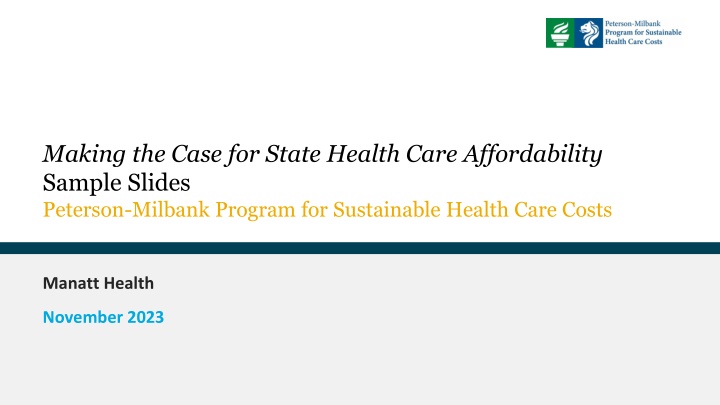
Making the Case for State Health Care Affordability Sample Slides Peterson-Milbank Program for Sustainable Health Care Costs Manatt Health November 2023
Table of Contents Introduction & Overview Acknowledgements How to Use This Analytic Resource Best Practices Sample Slides Executive Summaries (National and State) Detailed National and State Health Care and Affordability Trends Blank Template Slides Detailed Data & Sources 2 State Data Analytic Resources: Making the Case for State Health Care Affordability | Sample Slides | November 2023 | Manatt Health
Introduction National Health Care Spending State Health Care Spending Impacts on Consumers Conclusion Acknowledgements The Peterson-Milbank Program for Sustainable Health Care Costs, in partnership with Manatt Health and Burness, has developed a suite of Data Analytic Resources to provide states with direction on how health care data resources may be accessed, integrated, and analyzed in conjunction with benchmarking data to strengthen market insight and support policy action. The Data Analytic Resources and more information on the Peterson-Milbank Program for Sustainable Health Care are available on Milbank.org. 3 State Data Analytic Resources: Making the Case for State Health Care Affordability | Sample Slides | November 2023 | Manatt Health
Introduction National Health Care Spending State Health Care Spending Impacts on Consumers Conclusion How To Use This Data Analytic Resource This set of Sample Slides, featuring Washington State data, is intended to provide states with a starter set of easy-to-use, customizable slides that highlight national and state health care spending and affordability trends using universally available health care data. State Sample Slides Use the Databook that accompanies these slides, which includes data for all states, to select the data for your state. Instructions for customizing data visuals using the Databook are available in the Notes section of each slide. Note that these instructions were developed on PCs using Excel for Microsoft 365 and may not be fully applicable to other versions of Excel or Mac users. Users should also note that some tabs in the Databook have hidden rows or columns that are required for calculations or reference, users should not manipulate these columns when customizing visuals. Databook Other available Data Analytic Resources include the Health Care Cost and Affordability Data Resource Inventory & An Introductory Guide to Leveraging Health Care Cost and Affordability Data. 4 State Data Analytic Resources: Making the Case for State Health Care Affordability | Sample Slides | November 2023 | Manatt Health
Introduction National Health Care Spending State Health Care Spending Impacts on Consumers Conclusion Best Practices: Making the Most of the Sample Slides Expand and tailor the data-driven "story" in the samples slides to maximize your presentation s impact with its intended audience. Consumers, employers, health care industry stakeholders, and policymakers have different perspectives on and experiences with the health care system and the impacts of cost growth. For example, while consumers may be focused on the deteriorating value of their health care coverage, policymakers may be interested in understanding the growing cost burden faced by Medicaid and other state-funded health care programs. States may supplement the sample slides with data from other sources to reflect the interests of their audience (see the Health Care Cost and Affordability Data Resource Inventory for options). Share consumer stories. Bringing in personal anecdotes from residents struggling with health care costs can make your data feel more tangible and urgent. Stories that show the human toll of rising prices will resonate more than abstract statistics alone. Pick your peers. The sample slides allow for national and state data comparisons. When selecting peer states to compare your state to, consider geographic proximity, economic factors, and your state s policy goals. Minimize text. During a presentation, it can be more effective to minimize the amount of text on each slide by explaining the charts takeaways verbally. Presenters may wish to move the Takeaways summarized on each slide to the notes section to reduce the amount of text. 5 State Data Analytic Resources: Making the Case for State Health Care Affordability | Sample Slides | November 2023 | Manatt Health
Executive Summaries 6 State Data Analytic Resources: Making the Case for State Health Care Affordability | Sample Slides | November 2023 | Manatt Health
Introduction National Health Care Spending State Health Care Spending Impacts on Consumers Conclusion Executive Summary: The National Picture Rising health care costs are straining state budgets, burdening businesses, and forcing families to choose between going to the doctor and putting food on the table. National health care spending now comprises almost one out of every five dollars of our country s gross domestic product (GDP). Over the last two decades, national health care spending has nearly tripled, growing faster than national income. $ $ $ $ $ CMS projects that national health care spending will only continue to outpace GDP growth over the next decade. 7 State Data Analytic Resources: Making the Case for State Health Care Affordability | Sample Slides | November 2023 | Manatt Health
Introduction National Health Care Spending State Health Care Spending Impacts on Consumers Conclusion Executive Summary: Health Care Affordability in Washington State Washington State is working to address high health care costs, but we still have a long way to go. Premiums and deductibles represent Hospital care comprised The average Washingtonian spends $9,300 on health care, annually of all personal health care spending in 2020 in Washington State 40% of household wages in Washington State 55% Since 2000, Washington State s per person health care expenditures have more than doubled. Health insurance premiums for Washington State families are rising faster than earnings. Spending on hospital care services has more than doubled in Washington State since 2000. 8 State Data Analytic Resources: Making the Case for State Health Care Affordability | Sample Slides | November 2023 | Manatt Health
Introduction National Health Care Spending State Health Care Spending Impacts on Consumers Conclusion Executive Summary: Impacts on Washingtonians High health care costs are keeping Washingtonians from getting the care they need and pushing them into debt. 1 in 10 Washingtonians facefinancial barriers to care. High health care costs are increasingly contributing to health care- driven debt. In Washington State, individuals that have medical debt in collections owe a median amount of $551. $$$ 1 in 5 Hispanic residents facefinancial barriers to care. $$$ 9 State Data Analytic Resources: Making the Case for State Health Care Affordability | Sample Slides | November 2023 | Manatt Health
Sample Slides: National Health Care and Affordability Trends 10 State Data Analytic Resources: Making the Case for State Health Care Affordability | Sample Slides | November 2023 | Manatt Health
Introduction National Health Care Spending State Health Care Spending Impacts on Consumers Conclusion Over the last two decades, national health care spending has nearly tripled, growing faster than national income to comprise almost $1 out of every $5 of our country s gross domestic product. National Health Expenditures as % of GDP (2001 2021) Takeaways: $30 National health expenditures (NHE) represent annual health care spending in the US across public and private funding sources and various sponsors (businesses, households, governments). $23.6T $25 $18.8 $20 $15.6T Over the last two decades, NHE has nearly tripled. In 2001, NHE totaled approximately $1.5 trillion, growing to nearly $4.3 trillion dollars by 2021. $13.8T $15 $10.6T $10 Average annual growth in NHE (3.8%) has outpaced GDP growth (1.3%) over the same period. 18.0% 17.6% $5 17.2% 15.7% 14.0% In 2021, NHE represented 18% of the nation s GDP. $0 2001 2006 2011 2016 2021 NHE (Trillions) GDP (Trillions) Data Source(s): Historical and projected NHE data and projected GDP data from Centers for Medicare & Medicaid Services, Office of the Actuary, National Health Statistics Group. National Health Expenditure Accounts Data. Updated July 19, 2023. Available at: https://www.cms.gov/research-statistics-data-and-systems/statistics-trends-and-reports/nationalhealthexpenddata/nationalhealthaccountsprojected. Accessed July 31, 2023. Historical GDP data from The Bureau of Economic Analysis, National Income and Product Accounts. Updated September 28,2023. Available at: https://www.bea.gov/itable/national-gdp-and-personal-income. Accessed October 2, 2023. See Data Inventory Source #F3 (CMS National Health Expenditures (NHE) and State Health Expenditure Accounts (SHEA)) for full information. See Appendix for research notes. 11 State Data Analytic Resources: Making the Case for State Health Care Affordability | Sample Slides | November 2023 | Manatt Health
Introduction National Health Care Spending State Health Care Spending Impacts on Consumers Conclusion National health care spending is projected to continue to outpace GDP growth. Historical and Projected National Health Expenditures (NHE) and Gross Domestic Product (GDP) Over Time (2013 2031) Takeaways: The Centers for Medicare and Medicaid Services (CMS) projects that NHE will grow from $4.3 trillion to $7.2 trillion over the next decade, outpacing GDP growth to comprise a greater share of our national income (increasing from 18% in 2021 to 19.6%in 2031). $40.0 Projected GDP Growth $35.0 $30.0 $25.0 In Trillions NHE growth will partially be driven by higher Medicare enrollment and hospital spending levels. Hospital spending growth is projected to outpace spending on physician and clinical services and prescription drugs (5.8%, 5.3%, and 4.6%, respectively). $20.0 $15.0 Projected NHE Growth 19.6% $10.0 18% $5.0 Government spending is projected to comprise almost half of all national health care spending by 2031 (49%), up from 46% in 2019 and comparable to pandemic-level spending in 2021. $- 2013 2014 2015 2016 2017 2018 2019 2020 2021 2022 2023 2024 2025 2026 2027 2028 2029 2030 2031 Projected National Health Expenditures Gross Domestic Product Data Source(s): Historical and projected NHE data and projected GDP data from Centers for Medicare & Medicaid Services, Office of the Actuary, National Health Statistics Group. National Health Expenditure Accounts Data. Updated July 19, 2023. Available at: https://www.cms.gov/research-statistics-data-and-systems/statistics-trends-and-reports/nationalhealthexpenddata/nationalhealthaccountsprojected. Accessed July 31, 2023. Historical GDP data from The Bureau of Economic Analysis, National Income and Product Accounts. Updated September 28,2023. Available at: https://www.bea.gov/itable/national-gdp-and-personal-income. Accessed October 2, 2023. See Data Inventory Source #F3 (CMS National Health Expenditures (NHE) and State Health Expenditure Accounts (SHEA)) for full information. See Appendix for research notes. 12 State Data Analytic Resources: Making the Case for State Health Care Affordability | Sample Slides | November 2023 | Manatt Health
Introduction National Health Care Spending State Health Care Spending Impacts on Consumers Conclusion Despite spending twice as much on health, the US has lower life expectancy than comparable nations, and this gap worsened during the COVID-19 pandemic. Life Expectancy at Birth in Years (1980 2021) Takeaways: 86 The US spent nearly $13,000 per person on health care in 2021, more than twice the level of comparable counties ($6,125). (Data not shown.) 84 Comparable Country Average 82 Despite our higher rate of health care spending, life expectancy at birth in the US continues to lag that of peer countries (76.1 years vs. 82.4 years) for both men and women. Life expectancy, years 80 78 United States 76 Life expectancy in most countries decreased between 2019 and 2021 due to the COVID-19 pandemic, but the decrease in life expectancy in the US was far more acute than that experienced in peer countries (-2.7 years vs. -0.2 years). 74 72 1980 1981 1982 1983 1984 1985 1986 1987 1988 1989 1990 1991 1992 1993 1994 1995 1996 1997 1998 1999 2000 Year 2001 2002 2003 2004 2005 2006 2007 2008 2009 2010 2011 2012 2013 2014 2015 2016 2017 2018 2019 2020 2021 Note: Dollars are adjusted for purchasing power parity (PPP) Data Source(s): Peterson-KFF Health System Tracker. How does U.S. life expectancy compare to other countries? Accessed July 31, 2023. See also: Peterson-KFF Health System Tracker. How does health spending in the U.S. compare to other countries? Accessed August 17, 2023. See Appendix for research notes. 13 State Data Analytic Resources: Making the Case for State Health Care Affordability | Sample Slides | November 2023 | Manatt Health
Introduction National Health Care Spending State Health Care Spending Impacts on Consumers Conclusion Cost-related barriers to care vary widely by race and ethnicity. Share of Nonelderly Adults Reporting Selected Barriers to Accessing Health Care by Race / Ethnicity, 2021 Takeaways: In 2021, the share of Black adults (7.2%), American Indians / Alaskan Natives (AI/ANs, 7.8%), Native Hawaiians and Other Pacific Islanders (NHOPIs, 14.1%), and Hispanic adults (8%) who reported going without needed care due to cost in 2021 was higher than the share of white adults (5.8%) who reported the same barrier. 25.0% 21.5% 20.0% 14.1% 13.9% 15.0% 10.3% 9.3% 10.0% 8.7% 8.5% 8.0% 7.8% 7.2% 7.2% 7.1% 7.0% 6.8% Similarly, the share of Black adults (9.3%), NHOPIs (21.5%), and Hispanics (8.5%) who reported not taking medication as prescribed due to cost was higher than the share of white adults (6.3%) and Asian adults (5.1%). 6.3% 6.1% 5.8% 5.1% 5.0% 3.1% 2.6% 0.0% 0.0% Did not get needed care due to cost Delayed care due to cost Did not take medication as prescribed due to cost White Black or African American American Indian or Alaska Native Asian Native Hawaiian or Other Pacific Islander Hispanic or Latino Total Data Source(s): National Center for Health Statistics. Percentage of adults aged 18 and over who did not get needed medical care due to cost in the past 12 months, US, 2021; Percentage of adults aged 18 and over who delayed getting medical care due to cost in past 12 months, US, 2021; and Percentage of adults aged 18 and over who did not take medication as prescribed to save money in the past 12 months, US, 2021. National Health Interview Survey. Available at: https://wwwn.cdc.gov/NHISDataQueryTool/SHS_adult/index.html. Accessed August 28, 2023. See Appendix for research notes. 14 State Data Analytic Resources: Making the Case for State Health Care Affordability | Sample Slides | November 2023 | Manatt Health
Sample Slides: State Health Care and Affordability Trends 15 State Data Analytic Resources: Making the Case for State Health Care Affordability | Sample Slides | November 2023 | Manatt Health
Introduction National Health Care Spending State Health Care Spending Impacts on Consumers Conclusion Since 2000, Washington State s health care expenditures have more than doubled to nearly $9,300 per person. Health Care Spending in Washington State Compared to Peer States (Per Capita, 2000 2020) Takeaways: In 2020, Americans spent nearly $10,200 on health care per person more than doubling over the previous two decades (+149%). $12,000 United States, $10,191 Per Capita Personal Health Care Spending California, $10,299 Oregon, $10,071 Washington, $9,265 $9,000 Washington State residents have had a similar experience, with per capita health care spending growing by 140% during the period (from $3,863 in 2000 to $9,265 in 2020), or by approximately 4.5% annually. Colorado, $8,583 Idaho, $8,148 $6,000 $3,000 Washington State s rate of health care spending growth was faster than that of peer states like Colorado and Idaho but slower than that of California and Oregon. $- 2000 2005 2010 2015 2020 United States Colorado Idaho California Oregon Washington Data Source(s): Centers for Medicare & Medicaid Services, Office of the Actuary, National Health Statistics Group. National Health Expenditure Data: Health Expenditures by State of Residence, 1991-2020. Accessed June 22, 2023. See Data Inventory Source #F3 (CMS National Health Expenditures (NHE) and State Health Expenditure Accounts (SHEA)) for full information. See Appendix for research notes. 16 State Data Analytic Resources: Making the Case for State Health Care Affordability | Sample Slides | November 2023 | Manatt Health
Introduction National Health Care Spending State Health Care Spending Impacts on Consumers Conclusion In 2020, hospital care comprised 37.2% of per capita personal health care spending in Washington State. Washington State Health Care Spending by Category, 2020 Dental Services, $582 , 6% Takeaways: Other Personal Health Spending, $1,971 , 21% Hospital care comprised the greatest proportion of Washingtonians personal health care spending in 2020 (37.2 percent). Hospital care comprises all services provided by hospitals to patients, including room and board, ancillary charges, services of resident physicians, drugs administered in the hospital, and any other services billed by hospitals. Prescription Drugs and Other Non-durable Medical Products, $792 , 9% Physician & Clinical Services, $2,473 , 27% Physician and clinical services comprised 27 percent of per capita personal health care spending in Washington State in 2020. Hospital Care, $3,447 , 37% Data Source(s): Centers for Medicare & Medicaid Services, Office of the Actuary, National Health Statistics Group. National Health Expenditure Data: Health Expenditures by State of Residence, 1991 - 2020. Accessed July 31, 2023. See Data Inventory Source #F3 (CMS National Health Expenditures (NHE) and State Health Expenditure Accounts [SHEA]) for full information. See Appendix for research notes. 17 State Data Analytic Resources: Making the Case for State Health Care Affordability | Sample Slides | November 2023 | Manatt Health
Introduction National Health Care Spending State Health Care Spending Impacts on Consumers Conclusion Spending on hospital care services has nearly tripled in Washington State since 2000. Cumulative Spending Growth by Health Care Service Category in Washington State, 2000 2020 Takeaways: Health care spending growth in Washington State varied by service category over the past two decades. 200% 176% 180% 154% 160% 140% In addition to consuming the largest share of personal health care spending in Washington State from 2000 to 2020, Hospital Care grew at the fastest rate, nearly tripling (+176%) over the period. 136% 140% 120% 100% 75% 72% 80% Physician & Clinical Services, which includes services provided by medical professionals in health care establishments, more than doubled (+136%) in the same time period. 60% 40% 20% 0% Prescription Drugs (adjusted for rebates) and Dental Services spending grew at 72% and 75%, respectively over the 20-year period. Overall Personal Health Care Spending Hospital Care Physician & Clinical Services Prescription Drugs and Other Non-durable Medical Products Dental Services Other Personal Health Care Spending 2005 2010 2015 2020 Note: Estimates of prescription drug spending includes retail sales of products that are available only by a prescription. Prescription drug estimates are adjusted to account for manufacturers rebates that reduce insurers net payments for drugs. Data Source(s): Centers for Medicare & Medicaid Services, Office of the Actuary, National Health Statistics Group. National Health Expenditure Data: Health Expenditures by State of Residence, 1991 - 2020. Accessed July 31, 2023. See Data Inventory Source #F3 (CMS National Health Expenditures (NHE) and State Health Expenditure Accounts [SHEA]) for full information. See Appendix for research notes. 18 State Data Analytic Resources: Making the Case for State Health Care Affordability | Sample Slides | November 2023 | Manatt Health
Introduction National Health Care Spending State Health Care Spending Impacts on Consumers Conclusion Health insurance premiums for Washington State families continue to rise faster than earnings. Cumulative Average Family Premiums and Wage Growth in Washington State, 2011 - 2021 Takeaways: 60% A health insurance premium is the amount policyholders pay for health insurance coverage monthly. Premiums must be paid by policyholders regardless of whether they visit a doctor or use any other health care service. $21,914 50.5% 50% 37.6% 40% 33.7% Average Family Premiums 36.7% From 2011 to 2021, average family health insurance premiums in Washington State grew faster than average wages (51% and 37%, respectively). 30% 20% 23.3% 14.2% Annual health insurance premiums in 2021 now exceed $21,000, which is greater than the cost of a compact car (~$19,650[1]in the Seattle, Washington area). 8.0% 14.3% 10% Average Family Wages 0% 7.4% 3.6% 0% 0% 2011 2013 2015 2017 2019 2021 Washington Average Family Premium % Change, Cumulative Washington Washington Average Wage % Change, Cumulative Washington [1] For a 2021 Hyundai Elantra in zip code 98101. Data Source(s): Agency for Healthcare Research and Quality (AHRQ), Center for Financing, Access and Cost Trends. Medical Expenditure Panel Survey (MEPS) Insurance Component (IC). See Data Inventory Sources #F9 (MEPS-IC) and #F11 (OEWS Estimates) for full information. Accessed July 31, 2023. See Appendix for research notes. 19 State Data Analytic Resources: Making the Case for State Health Care Affordability | Sample Slides | November 2023 | Manatt Health
Introduction National Health Care Spending State Health Care Spending Impacts on Consumers Conclusion Families in Washington State are paying more in premiums but getting less coverage as the size of their deductibles grow. Average Family Premiums and Deductibles in Washington State, 2011 - 2021 $30,000 Takeaways: Average Family Deductibles (Potential Liability) Deductibles are the amount individuals and families are responsible for paying for covered health care services before their health insurance begins to cover service costs. $25,000 $20,000 $15,000 Over the 20 years from 2011 to 2021, deductibles in Washington State grew from $2,021 to over $3,500, an increase of 73%, compounding the effect of health care premium growth on the health care costs and liabilities facing Washington State families. $10,000 Average Family Premiums $5,000 $- 2011 2013 2015 2017 2019 2021 Average Family Premium and Deductible Average Family Premium Washington Data Source(s): Agency for Healthcare Research and Quality (AHRQ), Center for Financing, Access and Cost Trends. Medical Expenditure Panel Survey (MEPS) Insurance Component (IC). Accessed July 31, 2023. See Data Inventory Sources #F9 (MEPS-IC) and #F11 (OEWS Estimates) for full information. See Appendix for research notes. 20 State Data Analytic Resources: Making the Case for State Health Care Affordability | Sample Slides | November 2023 | Manatt Health
Introduction National Health Care Spending State Health Care Spending Impacts on Consumers Conclusion In Washington State, the cost burden of health insurance spending on premiums and deductibles has increased over the past 10 years. Overall Cost Burden of Health Insurance Relative to Average Household Wages, Washington State, 2011 2021 45% Takeaways: 39.0% 37.8% 37.0% 40% 35.9% 35.1% From 2011 to 2021, average premiums and deductibles as a share of average wages in Washington State grew from 33% to 37%, demonstrating the increasing cost burden of health insurance spending on Washington State families. 33.0% 5.1% 35% 5.5% 5.1% 5.1% Percent of Average Wages 4.9% 4.0% 30% 25% 20% 33.9% 32.3% 31.9% 30.8% 15% 30.2% 29.0% In 2021, average family premiums and deductibles totaled $25,416. Average family wages were approximately $68,740 in Washington State. 10% 5% 0% 2011 2013 2015 2017 2019 2021 Washington, Average Family Premium as a Percent of Average Wages Washington, Average Family Deductible as a Percent of Average Wages Data Source(s): Agency for Healthcare Research and Quality (AHRQ), Center for Financing, Access and Cost Trends. Medical Expenditure Panel Survey (MEPS) Insurance Component (IC). Accessed July 31, 2023. See Data Inventory Sources #F9 (MEPS-IC) and #F11 (OEWS Estimates) for full information. See Appendix for research notes. 21 State Data Analytic Resources: Making the Case for State Health Care Affordability | Sample Slides | November 2023 | Manatt Health
Introduction National Health Care Spending State Health Care Spending Impacts on Consumers Conclusion One in 10 Washingtonians and nearly 1 in 5 Hispanic residents face financial barriers to care. Respondents in Washington State That Needed To See A Doctor But Could Not Due to Cost, 2021 20% Takeaways: 18% 18% In 2021, nearly one in every five Hispanic nonelderly adults in Washington State reported that they could not see a doctor when they needed to due to cost (18%), more than twice the rate of white Washingtonians (7%). 16% 14% 12% 12% 11% 12% 10% 10% Nonelderly adults who were Black (11.2%), American Indians / Alaskan Natives (AI/ANs, 11.7%), or of another race (12.4%) also reported higher financial barriers to care access than white individuals (7.1%) . 7% 8% 6% 4% 4% 2% 0% Average White Black American Indian / Alaskan Native Asian Other Race Hispanic Ethnicity Data Source(s): Behavioral Risk Factor Surveillance System (BRFSS), 2021. Values included include weighted proportion of individuals in each race / ethnicity category who responded Yes to the question Was there a time in the past 12 months when you needed to see a doctor but could not because you could not afford it? BRFSS treats race and ethnicity as mutually exclusive categories. Accessed August 27, 2023. See Appendix for research notes. 22 State Data Analytic Resources: Making the Case for State Health Care Affordability | Sample Slides | November 2023 | Manatt Health
Introduction National Health Care Spending State Health Care Spending Impacts on Consumers Conclusion High health care costs are contributing to increasing levels of health care-driven debt. Share of Washingtonians with Medical Debt in Collections, 2022 Takeaways: "Medical debt" is a balance an individual may owe for health care services after the payment due date. Medical debt can appear on credit reports, lower credit scores, or go to collections (as shown). For some, medical debt can lead to bankruptcy, home foreclosures, or evictions. 20 in Washington State have some amount of medical debt 1 in every individuals Nationally, 1 in 10 individuals has some amount of medical debt in collections. Rates of medical debt are higher in communities of color (18.4%) than in majority-white communities (11%). medical debt In Washington State, 1 in 20 individuals has some amount of medical debt in collections (5%). in collections in collections. . Similar to national trends, rates of medical debt in collections in Washington State are higher in communities of color (6.2%) than in majority-white communities (4.4%). Data Source(s): The Urban Institute. Debt in America: Interactive Map. Accessed July 31, 2023. See also: KFF. Health Care Debt In The U.S.: The Broad Consequences Of Medical And Dental Bills. See Appendix for research notes. 23 State Data Analytic Resources: Making the Case for State Health Care Affordability | Sample Slides | November 2023 | Manatt Health
Introduction National Health Care Spending State Health Care Spending Impacts on Consumers Conclusion In Washington State, individuals that have medical debt in collections owe a median of $551. Median Medical Debt in Collections in Washington State, 2022 Takeaways: Most adults with health care debt report that the bills that led to their debt were from a one-time or short-term medical expense, which is often unexpected. As deductibles continue to grow, they can leave households more vulnerable to these unexpected and increasingly large medical bills. $600 $500 $551 $542 $400 $448 $300 Nationally, individuals who have medical debt in collections owe a median of $677. Washingtonians with medical debt in collections owe a median amount of $551. $200 $100 In contrast to national trends, median medical debt amounts in collections are higher for majority-white communities in Washington State ($542) than communities of color in Washington State ($448). $- Median Medical Debt in Collections, All Median Medical Debt in Collections, Communities of Color Median Medical Debt in Collections, Majority- White Communities Data Source(s): The Urban Institute. Debt in America: Interactive Map. Accessed July 31, 2023. See also: KFF, Health Care Debt In The U.S.: The Broad Consequences Of Medical And Dental Bills. See Appendix for research notes. 24 State Data Analytic Resources: Making the Case for State Health Care Affordability | Sample Slides | November 2023 | Manatt Health
Blank Template Slides 25 State Data Analytic Resources: Making the Case for State Health Care Affordability | Sample Slides | November 2023 | Manatt Health
Introduction National Health Care Spending State Health Care Spending Impacts on Consumers Conclusion [Compelling Slide Takeaway Here] [Title of Data Visual Here] [Insert Key Takeaway #1 here] [Insert Key Takeaway #2 here] [Insert Key Takeaway #3 here] [Insert Data Visual Here] [Insert Key Takeaway #4 here] [Insert Key Takeaway #5 here] Reminder: During a presentation, it can be more effective to minimize the amount of text on each slide by explaining the chart takeaways verbally. Data & Sources 26 State Data Analytic Resources: Making the Case for State Health Care Affordability | Sample Slides | November 2023 | Manatt Health
Introduction National Health Care Spending State Health Care Spending Impacts on Consumers Conclusion [Compelling Slide Takeaway Here] [Title of Data Visual Here] [Insert Key Takeaway #1 here] [Insert Key Takeaway #2 here] [Insert Key Takeaway #3 here] [Insert Data Visual Here] [Insert Key Takeaway #4 here] [Insert Key Takeaway #5 here] Data & Sources 27 State Data Analytic Resources: Making the Case for State Health Care Affordability | Sample Slides | November 2023 | Manatt Health
Introduction National Health Care Spending State Health Care Spending Impacts on Consumers Conclusion Additional Ideas for Data Use States may consider leveraging the blank template slides to highlight other relevant data trends and topics, including but not limited to: Data Use Example: Share of Annual Worker and Employer Premium Contributions for Family Coverage The share of employer and employee contributions to premiums to highlight employers costs and help galvanize employers and unions. Example: The Kaiser Family Foundation (KFF) analyzed average annual worker and employer premium contributions for family coverage, using data from the annual KFF Employer Health Benefit Survey, and found that the both the share of worker contributions and total premiums has increased from 2012 to 2022 (See 2022 Employer Health Benefits Survey, KFF. October 2022.) State health care expenditures as a share of total state GDP (sample visualization not included). Example: To demonstrate the impact of health care spending on the economy, states may consider calculating the total share of state health care expenditures as a percentage of state GDP using data from the Bureau of Economic Analysis (see Data Tools, BEA. October 2023.) Source: Kaiser Family Foundation. 2022 Employer Health Benefits Survey. Accessed October 4, 2023. 28 State Data Analytic Resources: Making the Case for State Health Care Affordability | Sample Slides | November 2023 | Manatt Health
Introduction National Health Care Spending State Health Care Spending Impacts on Consumers Conclusion Additional Ideas for Data Use States may consider leveraging the blank template slides to highlight other relevant data trends and topics, including but not limited to: Data Use Example: Percentage of Health Care Spending Relative to Total Household Budget The percentage of health care spending relative to total household budget. Example: The Oregon Health Authority (OHA) profiled how health-related spending comprises the greatest share of household budgets (22%), using data from the U.S. Bureau of Economic Analysis (BEA) (see Impact of Health Care Costs on People in Oregon, OHA. September 2023. Available here.) Life expectancy over time compared to total health care spending by state (sample visualization not included). Example: To build on the national trends highlighted on Slide 13, states may consider profiling state-specific life expectancy over time compared to total health care spending, using data from the Centers for Disease Control (CDC) (see Life Expectancy at Birth by State, CDC. August 2022.) Source: Oregon Health Care Authority. Impact of Health Care Costs on People in Oregon, 2021. Accessed October 4, 2023. 29 State Data Analytic Resources: Making the Case for State Health Care Affordability | Sample Slides | November 2023 | Manatt Health
Data & Sources 30 State Data Analytic Resources: Making the Case for State Health Care Affordability | Sample Slides | November 2023 | Manatt Health
Data & Sources Slides 11 12 Slide 11: National Health Expenditures as a Percent of GDP Over Time (2001 2021) and Slide 12: Historical and Projected National Health Expenditures (NHE) and Gross Domestic Product (GDP), 2013 2031 Historical and projected NHE data and projected GDP data from Centers for Medicare & Medicaid Services, Office of the Actuary, National Health Statistics Group. National Health Expenditure Accounts Data. Updated July 19, 2023. Available here: https://www.cms.gov/research-statistics-data- and-systems/statistics-trends-and-reports/nationalhealthexpenddata/nationalhealthaccountsprojected. Accessed July 31, 2023. Downloaded file: NHE Historical and Projections - Data (ZIP). Downloaded file: NHE Projections - Tables (ZIP) / National Health Expenditures and Selected Economic Indicators, Levels and Annual Percent Change: Calendar Years 2013 2031 Additional data source information is available at: https://www.cms.gov/Research-Statistics-Data-and-Systems/Statistics-Trends-and- Reports/NationalHealthExpendData/NationalHealthAccountsStateHealthAccountsResidence Related links: National Health Expenditure Projections, 2022 31: Growth To Stabilize Once The COVID-19 Public Health Emergency Ends, Health Affairs. June 14, 2023. https://www.healthaffairs.org/doi/full/10.1377/hlthaff.2023.00403. Accessed July 31, 2023. See also: Data Inventory Source #F3 (CMS National Health Expenditures (NHE) and State Health Expenditure Accounts (SHEA) for full information Historical GDP data from The Bureau of Economic Analysis, National Income and Product Accounts. Updated September 28,2023. Available at: https://www.bea.gov/itable/national-gdp-and-personal-income. Accessed October 2, 2023. Downloaded file: Table 1.1.5 Gross Domestic Product 31 State Data Analytic Resources: Making the Case for State Health Care Affordability | Sample Slides | November 2023 | Manatt Health
Data & Sources Slides 13 14 Slide 13: Life Expectancy at Birth in Years (1980 2021) Peterson-KFF Health System Tracker. How does U.S. life expectancy compare to other countries? December 6, 2022. Available at: https://www.healthsystemtracker.org/chart-collection/u-s-life-expectancy-compare-countries/. Accessed July 31, 2023. Comparable countries include: Australia, Austria, Belgium, Canada (except for 2021), France, Germany, Japan, the Netherlands, Sweden, Switzerland, and the U.K. See Methods section of "How does U.S. life expectancy compare to other countries?" Data from KFF analysis of CDC, OECD, Japanese Ministry of Health, Labour, and Welfare, Australian Bureau of Statistics, and UK Office for Health Improvement and Disparities data Slide 14: Share of Nonelderly Adults Reporting Selected Barriers to Accessing Health Care by Race / Ethnicity, 2021 National Center for Health Statistics. Percentage of adults aged 18 and over who did not get needed medical care due to cost in the past 12 months, US, 2021; Percentage of adults aged 18 and over who delayed getting medical care due to cost in past 12 months, US, 2021; and, Percentage of adults aged 18 and over who did not take medication as prescribed to save money in the past 12 months, US, 2021. National Health Interview Survey. Available at: https://wwwn.cdc.gov/NHISDataQueryTool/SHS_adult/index.html. Accessed August 28, 2023. 32 State Data Analytic Resources: Making the Case for State Health Care Affordability | Sample Slides | November 2023 | Manatt Health
Data & Sources Slides 16 17 Slide 16: Health Care Spending in Washington Compared to Peer States (Per Capita, 2000 2020) Centers for Medicare & Medicaid Services, Office of the Actuary, National Health Statistics Group. National Health Expenditure Data: Health Expenditures by State of Residence, 1991 - 2020. Available at: https://www.cms.gov/Research-Statistics-Data-and-Systems/Statistics-Trends-and- Reports/NationalHealthExpendData/NationalHealthAccountsStateHealthAccountsResidence. Accessed June 22, 2023. Downloaded file: Health expenditures by state of residence (ZIP), Table 11: Total All Payers Per Capita State Estimates by State of Residence (1991-2020) - Personal Health Care (Millions of Dollars). See also: Data Inventory Source #F3 (CMS National Health Expenditures (NHE) and State Health Expenditure Accounts [SHEA]) for full information Slide 17: Washington State Health Care Spending by Category, 2020 Centers for Medicare & Medicaid Services, Office of the Actuary, National Health Statistics Group. National Health Expenditure Data: Health Expenditures by State of Residence, 1991 2020. Available at: https://www.cms.gov/Research-Statistics-Data-and-Systems/Statistics-Trends-and- Reports/NationalHealthExpendData/NationalHealthAccountsStateHealthAccountsResidence. Accessed June 22, 2023. Downloaded file: US_PER_CAPITA20 Data is presented aggregate per capita, per year, in USD. All AAPG values had to be re-calculated via RRI given the revised time frame of the data (2000 - 2020). New category, "Other Personal Health Care Spending ($), Consolidated" combines Durable Medical Products, Home Health Care, Other Health, Residential and Personal Care, Other Professional Services into one category. New category, "Overall Personal Health Care Spending ($), Calculated" sums Dental Services, Hospital Care, Physician & Clinical Services, Prescription Drugs and Other Non-Durable Medical Products, and Other Personal Health Care Spending ($), Consolidated. Manatt analysis of category as a percentage of total personal health care spending for 2020. See also: Quick Definitions for National Health Expenditure Accounts (NHEA) Categories. Available here: https://www.cms.gov/files/document/quick- definitions-national-health-expenditures-accounts-nhea-categories.pdf. Accessed August 17, 2023. See also: Data Inventory Source #F3 (CMS National Health Expenditures (NHE) and State Health Expenditure Accounts (SHEA)) for full information State Data Analytic Resources: Making the Case for State Health Care Affordability | Sample Slides | November 2023 | Manatt Health 33
Data & Sources Slide 18 Slide 18: Percent Annual Growth (Cumulative) by Health Care Service Category in Washington State, 2000 2020 Centers for Medicare & Medicaid Services, Office of the Actuary, National Health Statistics Group. National Health Expenditure Data: Health Expenditures by State of Residence, 1991 2020. Available here: https://www.cms.gov/Research-Statistics-Data-and-Systems/Statistics-Trends-and- Reports/NationalHealthExpendData/NationalHealthAccountsStateHealthAccountsResidence. Accessed June 22, 2023. Downloaded file: US_PER_CAPITA20 Categories are same as described above. Manatt analysis of annual percent (cumulative) growth, 2000 2020, by health care service category. Estimates of prescription drug spending includes retail sales of products that are available only by a prescription. Prescription drug estimates are adjusted to account for manufacturers rebates that reduce insurers net payments for drugs. See also: National Health Expenditure Accounts: Methodology Paper, 2021. Available at: https://www.cms.gov/files/document/definitions-sources- and-methods.pdf. Accessed August 21, 2023. See also: Data Inventory Source #F3 (CMS National Health Expenditures (NHE) and State Health Expenditure Accounts (SHEA)) for full information. 34 State Data Analytic Resources: Making the Case for State Health Care Affordability | Sample Slides | November 2023 | Manatt Health
Data & Sources Slide 19 Slide 19: Cumulative Annual Percent Growth in Average Family Premiums and Wages in Washington State from 2011 2021 Agency for Healthcare Research and Quality (AHRQ), Center for Financing, Access and Cost Trends. Medical Expenditure Panel Survey (MEPS) Insurance Component (IC). Available here: https://datatools.ahrq.gov/meps-ic/?tab=private-sector-state&dash=26. Average Total Family Premiums and Deductibles (in Dollars) per Enrolled Employee at Private-Sector Establishments That Offer Health Insurance, United States, 2011 2021. This dataset compiles MEPS-IC Average Total Family Premium and Deductible Amounts (in Dollars) Per Enrolled Employee at Private- Sector Establishments that Offer Health Insurance by Total, United States, for Years 2021, 2019, 2017, 2015, 2013, and 2011. Note: 2007 data were not collected for the Insurance Component. Note: In the original datasets, a column for "Measure Names" included Std. Error, 95% CI Upper, 95% CI Lower, and Estimate for each corresponding Measure Value (average total family premium for employees per year). For purposes of this Databook, only data from the "Estimate" Measure Name column is provided. Note: In the original datasets, columns for "Group Level," "Reliability" and "Suppressed" were provided but either uniform in data ("Total") or blank. These columns were removed for purposes of this Databook. Note: $ difference calculated; Percent increase calculated; Estimated Annual % Growth calculated using RRI function in Excel. See also: Data Inventory Source #F9 (MEPS-IC) for full information Bureau of Labor Statistics. Occupational Employment and Wage Statistics (OEWS) Survey Data. Available here: https://www.bls.gov/oes/tables.htm Downloaded State XLSX Files Data pulled from columns "Area Name" and "A_MEAN" (mean annual wage) for respective years for All Occupations. Estimated Annual % Growth calculated using RRI function in Excel. See also: Data Inventory Source #F11 (Occupational Employment and Wage (OEWS) Estimates ) for full information. 35 State Data Analytic Resources: Making the Case for State Health Care Affordability | Sample Slides | November 2023 | Manatt Health
Data & Sources Slide 20 Slide 22: Average Family Premiums and Deductibles in Washington State, 2011 2021 Agency for Healthcare Research and Quality (AHRQ), Center for Financing, Access and Cost Trends. Medical Expenditure Panel Survey (MEPS) Insurance Component (IC). Available at: https://datatools.ahrq.gov/meps-ic/?tab=private-sector-state&dash=26. Average Total Family Premiums and Deductibles (in Dollars) per Enrolled Employee at Private-Sector Establishments That Offer Health Insurance, United States, 2011 2021. This dataset compiles MEPS-IC Average Total Family Premium and Deductible Amounts (in Dollars) Per Enrolled Employee at Private- Sector Establishments that Offer Health Insurance by Total, United States, for Years 2021, 2019, 2017, 2015, 2013, and 2011. Note: 2007 data were not collected for the Insurance Component. Note: In the original datasets, a column for "Measure Names" included Std. Error, 95% CI Upper, 95% CI Lower, and Estimate for each corresponding Measure Value (average total family premium for employees per year). For purposes of this Databook, only data from the "Estimate" Measure Name column is provided. Note: In the original datasets, columns for "Group Level," "Reliability" and "Suppressed" were provided but either uniform in data ("Total") or blank. These columns were removed for purposes of this Databook. Note: $ difference calculated; Percent increase calculated; Estimated Annual % Growth calculated using RRI function in Excel. See also: Data Inventory Source #F9 (MEPS-IC) for full information Bureau of Labor Statistics. Occupational Employment and Wage Statistics (OEWS) Survey Data. Available here: https://www.bls.gov/oes/tables.htm Downloaded State XLSX Files. Data pulled from columns "Area Name" and "A_MEAN" (mean annual wage) for respective years for All Occupations. Estimated Annual % Growth calculated using RRI function in Excel. See also: Data Inventory Source #F11 (Occupational Employment and Wage (OEWS) Estimates ) for full information. 36 State Data Analytic Resources: Making the Case for State Health Care Affordability | Sample Slides | November 2023 | Manatt Health
Data & Sources Slides 21 22 Slide 21: Respondents in Washington State That Needed To See A Doctor But Could Not Because Of Cost, 2021 Behavioral Risk Factor Surveillance System (BRFSS), 2021. Values included include weighted proportion of individuals in each race / ethnicity category who responded Yes to the question Was there a time in the past 12 months when you needed to see a doctor but could not because you could not afford it? Accessed August 27, 2023. Data were analyzed in SAS Enterprise Guide version 8.3 using Proc SurveyFreq to account for the weighted nature of the BRFSS data BRFSS treats race / ethnicity as mutually exclusive categories The BRFSS race / ethnicity categories for Native Hawaian / Pacific Islander and Other were collapsed into a single Other category to mitigate data gaps at the state level due to low counts for these categories in some states. US totals exclude data from the territories (e.g., Guam, Puerto Rico, and Virgin Islands). See also: Information about the BRFSS is available at http://www.cdc.gov/brfss/index.html. Slide 22: Share of Washingtonians with Medical Debt in Collections Compared to National Estimates, 2022 The Urban Institute. Debt in America: Interactive Map. Last updated June 23, 2022. Available at: https://apps.urban.org/features/debt-interactive- map/?type=medical&variable=medcoll. Accessed July 31, 2023. Downloaded file: Debt in America: State-Level Medical Debt. Available at: https://datacatalog.urban.org/dataset/debt-america-2022. See also: KFF. Health Care Debt In The U.S.: The Broad Consequences Of Medical And Dental Bills. June 16, 2022. Available at: https://www.kff.org/report-section/kff-health-care-debt-survey-main-findings/. Accessed August 17, 2023. See also: Peterson-KFF Health System Tracker: The burden of medical debt in the United States. March 10, 2022. Available at: https://www.healthsystemtracker.org/brief/the-burden-of-medical-debt-in-the-united- states/#Share%20of%20adults%20who%20have%20more%20than%20$250%20in%20medical%20debt,%20by%20demographic,%202019. Accessed August 21, 2023. 37 State Data Analytic Resources: Making the Case for State Health Care Affordability | Sample Slides | November 2023 | Manatt Health
Data & Sources Slide 23 Slide 23: Median Medical Debt in Collections in Washington State and Nationally, 2022 The Urban Institute. Debt in America: Interactive Map. Last updated June 23, 2022. Available here: https://apps.urban.org/features/debt-interactive- map/?type=medical&variable=medcoll. Accessed July 31, 2023. Downloaded file: Debt in America: State-Level Medical Debt. Available here: https://datacatalog.urban.org/dataset/debt-america-2022. See also: KFF. Health Care Debt In The U.S.: The Broad Consequences Of Medical And Dental Bills. June 16, 2022. Available at: https://www.kff.org/report-section/kff-health-care-debt-survey-main-findings/. Accessed August 17, 2023. See also: Peterson-KFF Health System Tracker: The burden of medical debt in the United States. March 10, 2022. Available at: https://www.healthsystemtracker.org/brief/the-burden-of-medical-debt-in-the-united- states/#Share%20of%20adults%20who%20have%20more%20than%20$250%20in%20medical%20debt,%20by%20demographic,%202019. Accessed August 21, 2023. 38 State Data Analytic Resources: Making the Case for State Health Care Affordability | Sample Slides | November 2023 | Manatt Health
