Solving Linear Equations and Inequalities


L.O. To be able to interpret
pie charts
Think
Pair
Share

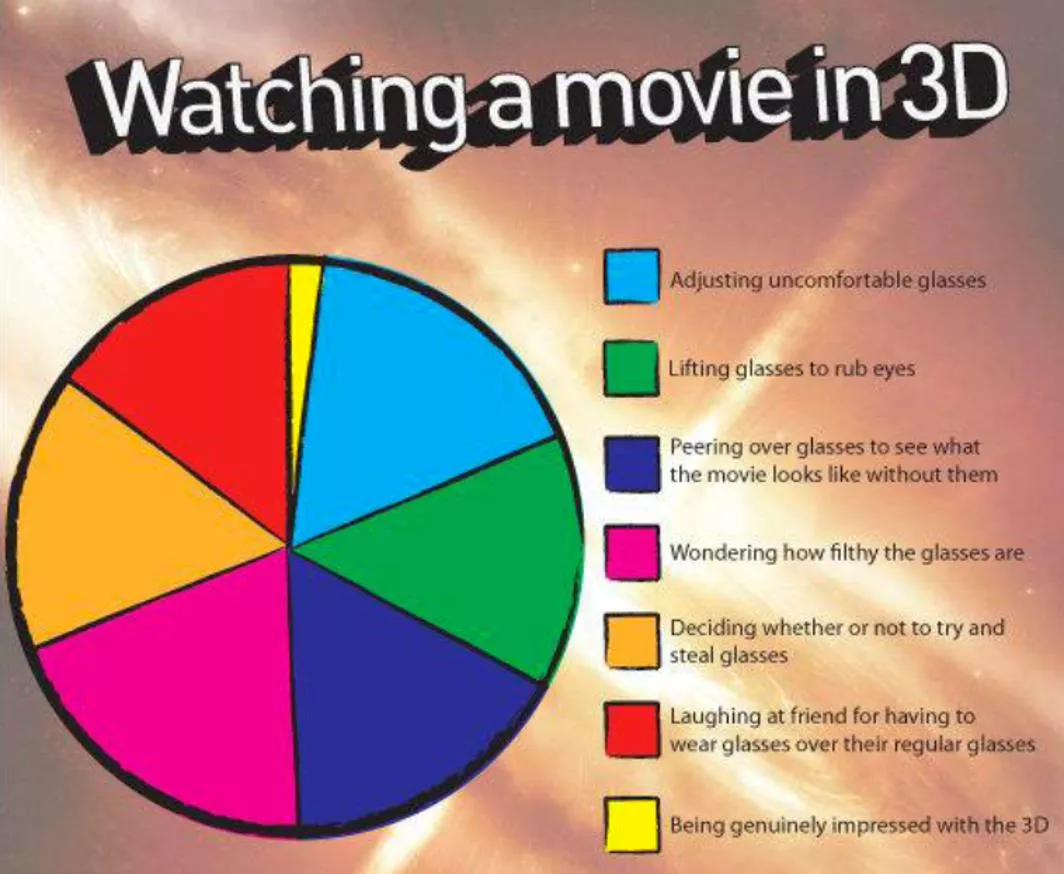

The chart shows 40 skittles from a pack. There are:
10 red skittles
4 green skittles
8 blue skittles
5 orange skittles
13 yellow skittles
•
Starting at 1, colour in
the skittles.
•
Divide the pie chart
into the sections.
•
Label each section
with the appropriate
fraction and
percentage.
25%
1
4
10%
1
10
1
5
20%
12.5%
1
8
1
(approx)
3
33.3%
WINK: What I Now Know
Explore linear equations and inequalities, analyze key features of graphs, solve systems of equations, represent constraints graphically, rearrange formulas, and recognize arithmetic sequences. Essential questions delve into creating equations from graphs and justifying solutions. Enhance your vocabulary with terms like algebra, function, inequality, and more. By the end of the unit, you will be proficient in justifying solutions to various linear equations and inequalities.

Download Presentation

Please find below an Image/Link to download the presentation.
The content on the website is provided AS IS for your information and personal use only. It may not be sold, licensed, or shared on other websites without obtaining consent from the author.If you encounter any issues during the download, it is possible that the publisher has removed the file from their server.
You are allowed to download the files provided on this website for personal or commercial use, subject to the condition that they are used lawfully. All files are the property of their respective owners.
The content on the website is provided AS IS for your information and personal use only. It may not be sold, licensed, or shared on other websites without obtaining consent from the author.
E N D
Presentation Transcript
L.O. To be able to interpret pie charts Think Pair Share
The chart shows 40 skittles from a pack. There are: 10 red skittles 4 green skittles 8 blue skittles 5 orange skittles 13 yellow skittles 1 Starting at 1, colour in the skittles. Divide the pie chart into the sections. Label each section with the appropriate fraction and percentage.
25% 1 (approx) 3 1 4 33.3% 10% 1 10 1 8 20% 1 5 12.5%
WINK: What I Now Know R RA AG G 1 2 3 1 2 3 Effort Understanding Unsatisfactory effort: not trying hard and distracted from learning. Struggling to understand this work. R 3 3 Good understanding for most of the work. Good effort; mostly concentrating but could have tried harder. A 3 2 Excellent understanding; can explain to someone else. Excellent effort: concentrated, focussed and tried hard. G 1 3