Solving Linear Equations and Inequalities in Two Variables
Learn how to solve linear equations and inequalities in two variables by graphing them on a coordinate plane. Understand the steps for graphing inequalities, including determining solid or dashed lines and shading above or below the line. Explore examples and tips for shading regions correctly to find solutions to systems of linear inequalities.

Download Presentation

Please find below an Image/Link to download the presentation.
The content on the website is provided AS IS for your information and personal use only. It may not be sold, licensed, or shared on other websites without obtaining consent from the author.If you encounter any issues during the download, it is possible that the publisher has removed the file from their server.
You are allowed to download the files provided on this website for personal or commercial use, subject to the condition that they are used lawfully. All files are the property of their respective owners.
The content on the website is provided AS IS for your information and personal use only. It may not be sold, licensed, or shared on other websites without obtaining consent from the author.
E N D
Presentation Transcript
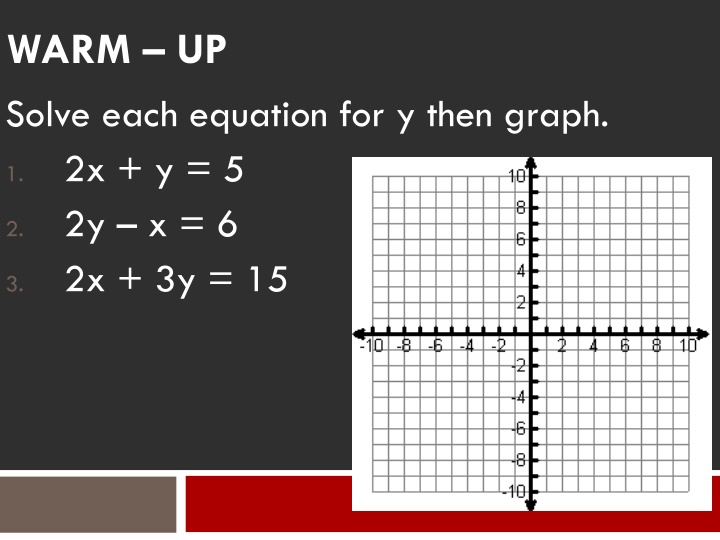
WARM UP Solve each equation for y then graph. 2x + y = 5 2y x = 6 2x + 3y = 15 1. 2. 3.
GSE Algebra I 2.6 UNIT QUESTION: How do I justify and solve the solution to a system of equations or inequalities? Standard: MCC9-12.A.REI.1, 3, 5, 6, and 12 Today s Question: How do I know where to shade when graphing linear inequalities? Standard: MCC9-12.A.REI.12
SOLVING LINEAR INEQUALITIES IN TWO VARIABLES Coordinate Plane
Half plane A region containing all points that has one boundary, which is a straight line that continues in both directions infinitely.
Steps for Graphing Inequalities 1. Get in slope-intercept form 2. Determine solid ( )or dashed line (< >) 3. Determine whether to shade above or shade below the line (Test Points) 4. If the test point is true, shade the half plane containing it. 5. If the test point is false, shade the half plane that does NOT contain the point.
Symbols Dashed Line < > Shade Left or Below Shade right or Above
Symbols Solid Line
Ex. 1 y 3 x 7 +
Ex. 2 1 3 y x 4
Ex.3 x 2 y 6
Ex. 4 2 x y 4
SOLVING SYSTEMS OF LINEAR INEQUALITIES IN TWO VARIABLES Coordinate Plane
System of Inequalities Graph the line and appropriate shading for each inequality on the same coordinate plane.
System of Inequalities Remember: DASHED for < and >, and SOLID for and .
Solution to a System of Linear Inequalities The solution is the section where all of the shadings overlap. Sometimes it helps to use different color pencils for each line and shaded region. It makes it easier to determine the overlapped shaded regions.
Ex. 5 y y 2x 1 2x + 5 +
Ex. 6 y y 2x 1 2x + 5 +
Ex. 7 It takes 2 hours to make the blade of a figure skate. It takes 3 hours to make the blade of a hockey skate. There is a maximum of 40 hours per week in which the blades can be made for both types of skates. It takes 3 hours to make the boot of a figure skate. It takes 1 hour to make the boot for a hockey skate. There is a maximum of 20 hours per week in which boots can be made for both types of skates.
Ex. 7 1. What is the inequality that represents the time it takes to make the blades of the two different types of skates? 2 + x 3 y 40 2. What is the inequality that represents the amount of time it takes to make the boots of the two different skates? 3 x y 20 +
Ex. 7 Graph and consider some constraints to the problem. What is the solution of all possible combinations of figure skates and hockey skates that can be produced given the constraints of this situation?
Ex. 8 Which system of inequalities represents the graph below?
Ex. 9 Brenda s high school theater can seat at most 400 people. Adult tickets are $5 and student tickets are $2. The school must make at least $1000 for the show to go on. Which region represents the possible numbers of adult and student tickets sold that meet the given conditions?
Homework Worksheet