Robbie's Field of View Challenge at the Championship Game
Robbie plans to watch the sold-out championship game by looking through a drainage pipe at the stadium. With the help of a model provided by his teacher, he aims to determine the field of view he will have, make predictions, calculate the area visible to him, and assess the probability of seeing a touchdown. By creating a scatterplot, finding the line of best fit, and exploring the associated math concepts, Robbie navigates the exciting challenge ahead.
Download Presentation

Please find below an Image/Link to download the presentation.
The content on the website is provided AS IS for your information and personal use only. It may not be sold, licensed, or shared on other websites without obtaining consent from the author.If you encounter any issues during the download, it is possible that the publisher has removed the file from their server.
You are allowed to download the files provided on this website for personal or commercial use, subject to the condition that they are used lawfully. All files are the property of their respective owners.
The content on the website is provided AS IS for your information and personal use only. It may not be sold, licensed, or shared on other websites without obtaining consent from the author.
E N D
Presentation Transcript
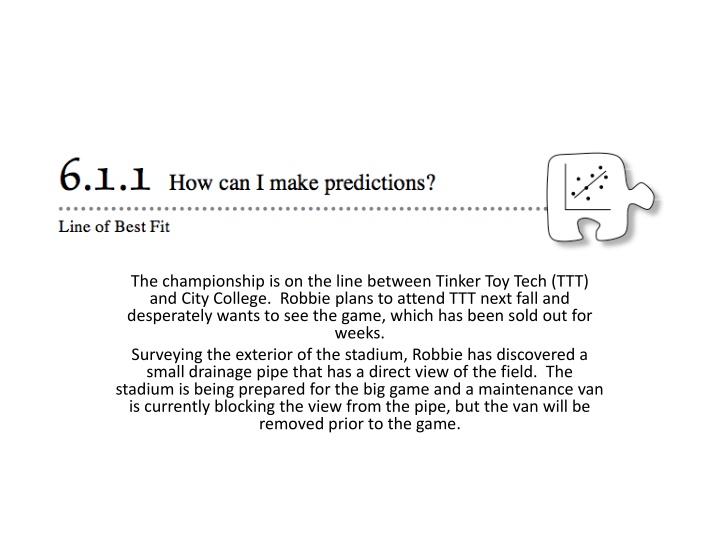
The championship is on the line between Tinker Toy Tech (TTT) and City College. Robbie plans to attend TTT next fall and desperately wants to see the game, which has been sold out for weeks. Surveying the exterior of the stadium, Robbie has discovered a small drainage pipe that has a direct view of the field. The stadium is being prepared for the big game and a maintenance van is currently blocking the view from the pipe, but the van will be removed prior to the game.
6-1. The south end of the field is 50 yards from the end of the pipe and the field image runs from north to south. The total length of the playing field, including the end zones, is 120 yards. The pipe will be at the center of the south end of the field. The width of the field is 53.3 yards (160 feet). Investigate how much of the field Robbie will be able to see when he looks through the pipe at game time.
6-1 To assist Robbie with this problem we will need to create a model to collect data. Your teacher will provide you with a view tube that has the same dimensions as the pipe through which Robbie will be looking.
6-1 b) Make a scatterplot of your data. Describe the association between the field of view and distance from the wall. If you need a reminder about how to describe associations, see the Math Notes box in Lesson 4.2.1. c) Draw a line of best fit that models your data and will allow you to make predictions. What is the equation of your line of best fit? d) What do the slope and y-intercept represent in the context of the problem? 6-2. Predict how wide (in yards) Robbie s field of view will be at the south end of the field. How wide will it be at the north end in yards?
6-3. On your paper, sketch the football field, including the end zones and label the dimensions. Using a different color, shade the part of the field that Robbie can see. a) Find the area of the field of view. b) What percent of the field will Robbie be able to see? c) The game comes down to the final play in the fourth quarter with TTT driving towards the north goal line. The end zones are 10 yards deep, so the north goal line is 10 yards before the north end of the playing field. What is the probability Robbie sees the touchdown?
